Users Guide
If you are using, or planning to use, VisTrails, please subscribe to the vistrails users mailing list. Details on how to do that are available here.
Getting_Started
VisTrails is available on Windows XP, Mac OS X, and Linux. These versions all have the same functionality and only differ in user interface as noted throughout this document.
There are different download options, available here. It is substantially easier to start with a binary version, and this is encouraged for first-time users. If you decided on a source version (maybe because a binary version for your architecture is not available at this time), please follow the instructions on building the software from source available here.
Starting up the binary version is system depended. On Windows XP and Mac OS X, it requires clicking on the application icon. To start the binary version on any system, you should change directory to "src/vistrails/trunk/vistrails/", where the "vistrails.py" file is available. You can start VisTrails with the following command: "python vistrails.py -l".
Depending on a number of factors, it can take a few seconds for the system to start up. You will see a splash screen while that happens. On the console, you will see some messages that show the packages being loaded. On my Mac OS X system, I get the following:
 Initializing  vtk
 Initializing  pythonCalc
 Initializing  spreadsheet
 Loading Spreadsheet widgets...
   ==> Successfully import <Basic Widgets>
   ==> Successfully import <Image Viewer>
   ==> Successfully import <VTK Viewer>
   ==> Successfully import <HTML Viewer>
   ==> Successfully import <SVG Widgets>
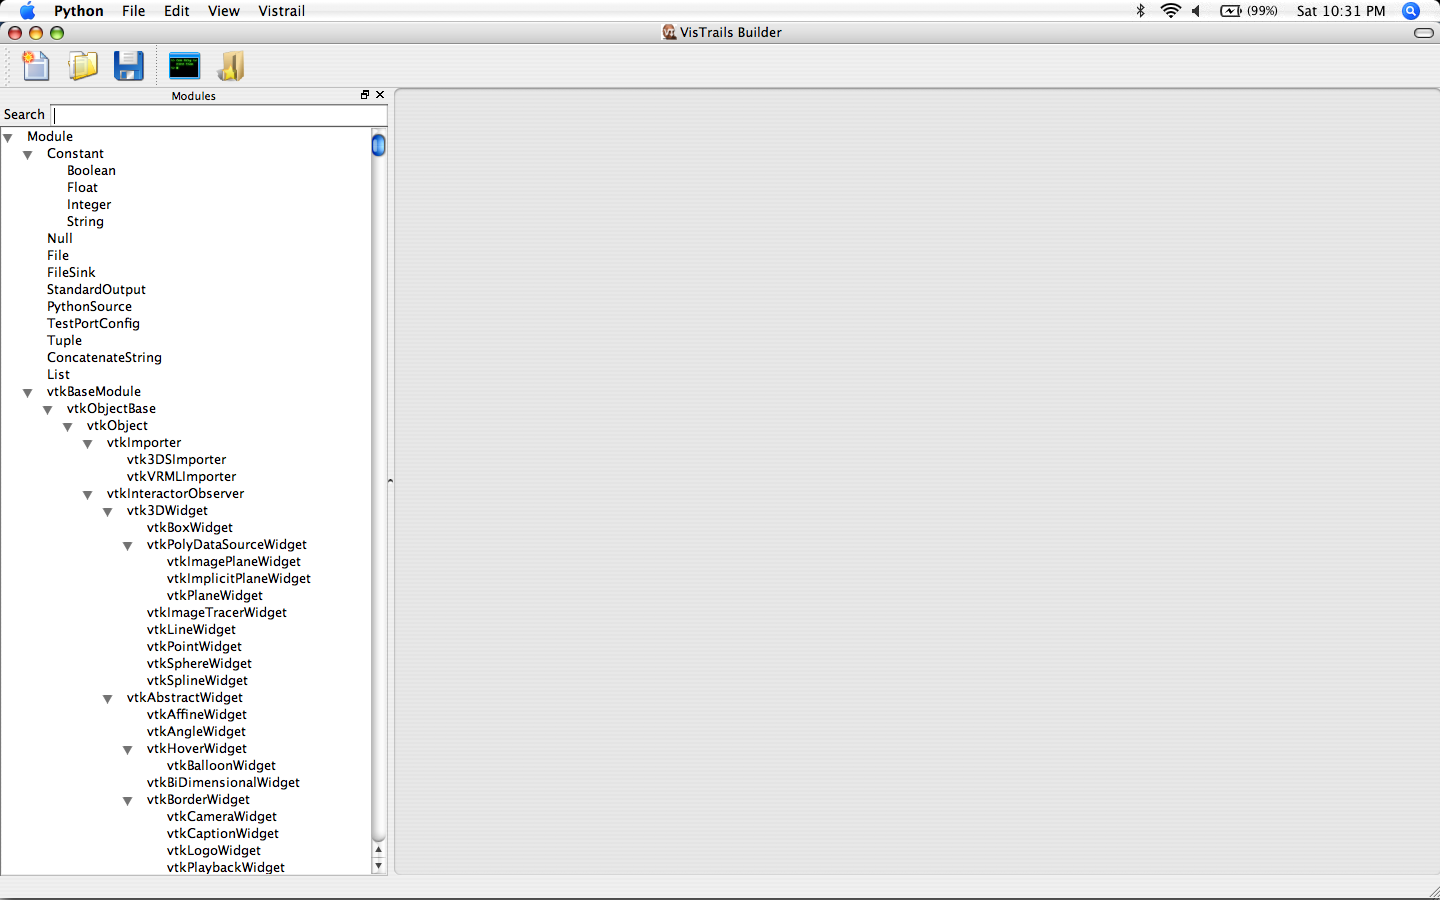
Also, I get two separate windows, the VisTrails Builder:
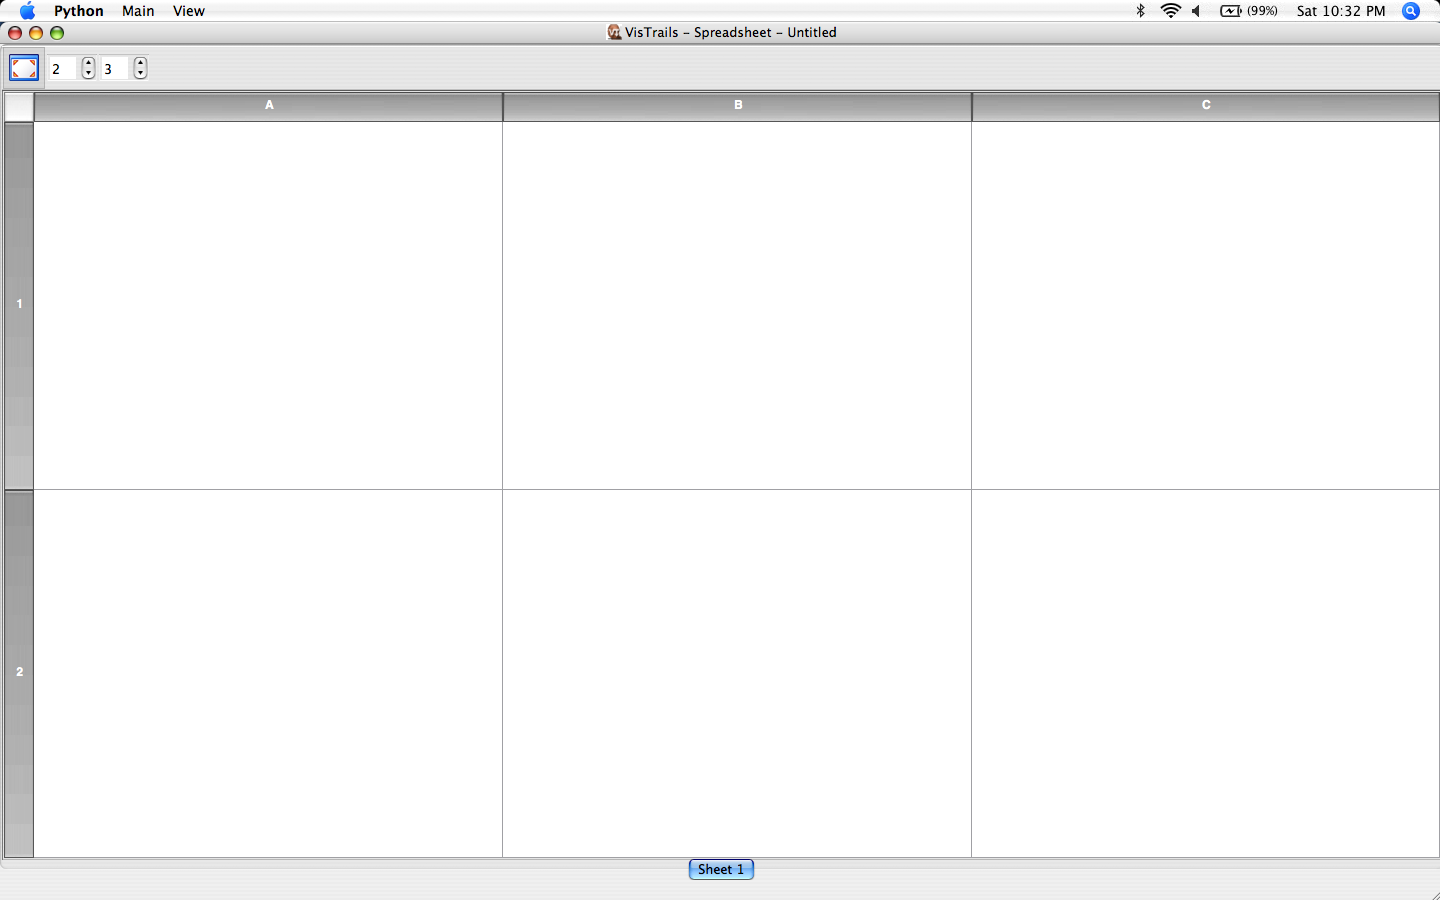
And the VisTrails Spreadsheet:
You are now ready to load a vistrail inside the system. Go to the Builder, and under "File",
there will be an "Open" option. After clicking it, you will be giving a list of files, and you can
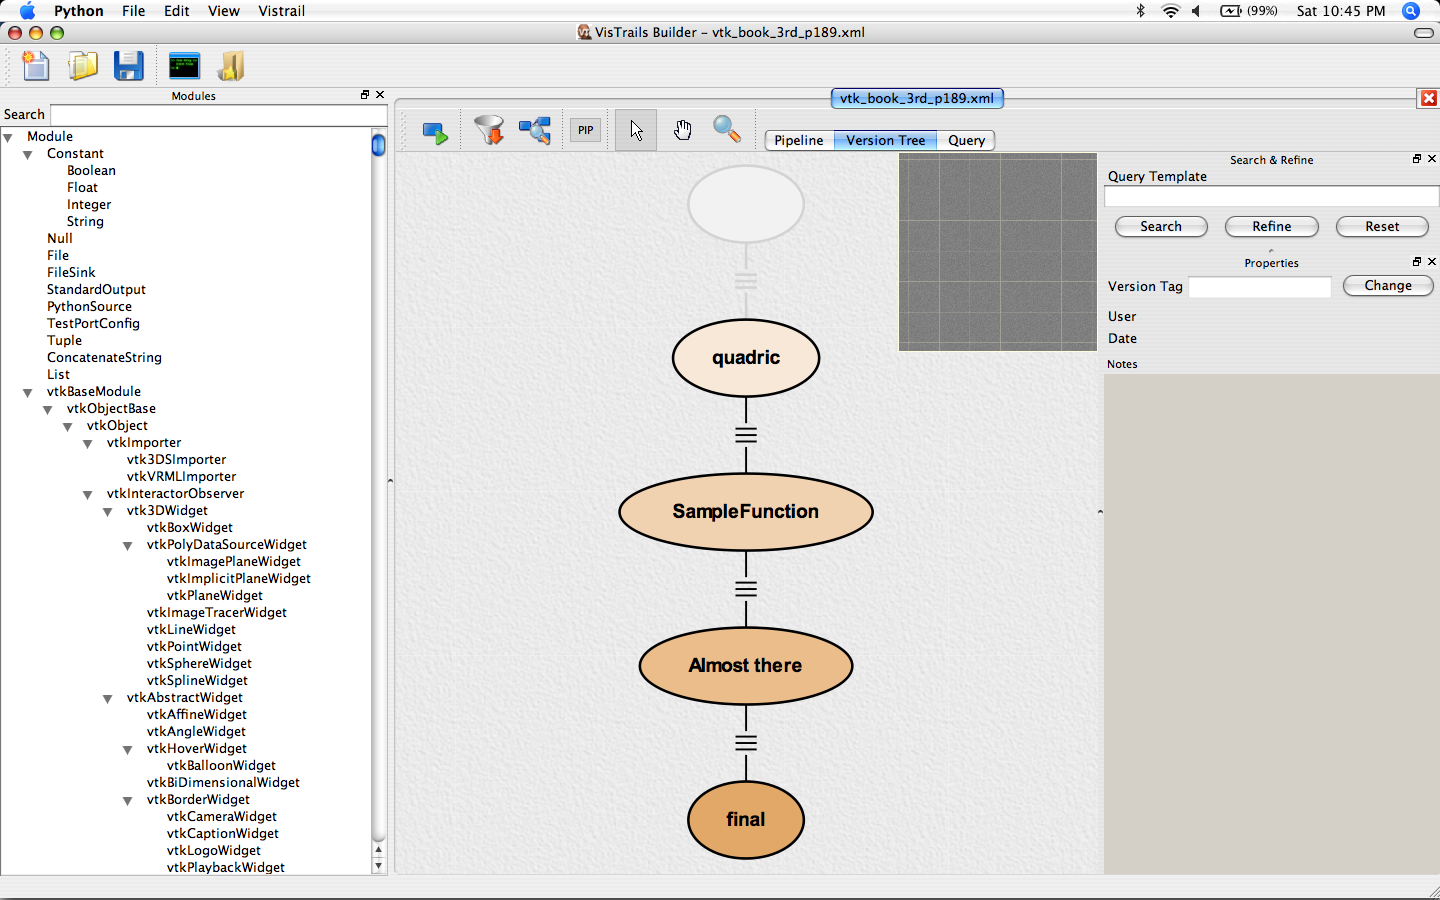
load any of the vistrails there. For instance, if you load the "vtk_book_3rd_p189.xml", your
screen will look like this:
Each "oval" correspond to a different workflow. If you click on "final", you can "execute" that workflow
either by clicking on the execute the workflow icon: ![]() .
.
More details on interacting with the components of VisTrails are available below.
VisTrails Builder
You can create and edit dataflows (workflows) using the Vistrail Builder user interface. The dataflow specifications are saved in a repository that can be either local or remote. For now, we only discuss local repository here, which are "xml" files by default.
A key feature of VisTrails is the support for full provenance of the exploration process. For this, we introduced the notion of a visual trail, or a vistrail. A vistrail captures the evolution of a dataflow---all steps followed to construct a set of workflows. It represents several versions of a dataflow (which differ in their specifications), their relationships, and their instances (which differ in the parameters used in each particular execution). VisTrails uses a change-based model to capture provenance. As the scientist makes modifications to a particular dataflow, the provenance mechanism records those changes. Instead of storing a set of related dataflows, VisTrails stores the operations or changes that are applied to the dataflows, e.g., the addition of a module, the modification of a parameter, etc.
This representation is both simple and compact---it uses substantially less space than the alternative of storing multiple versions of a dataflow. In addition, it enables the construction of an intuitive interface that allows scientists to both understand and interact with the history of the dataflow through these changes. A tree-based view allows a scientist to return to a previous version in an intuitive way; to undo bad changes; to compare different dataflows; and be reminded of the actions that led to a particular result.
The Builder is roughly divided into three main regions. In the left, a list of modules that can be used for building particular workflows are listed. The middle is the main workflow interaction area, which can be toggled to display an instance of a workflow, or the vistrail, which corresponds to the collection of a number of different instances. On the right, there is a context sensitive menu that can be used for operating on the properties of what is being shown in the middle.
VisTrails Modules
Modules are the basic building blocks of workflows. In general, each module has a number of inputs, a number of outputs, and a set of parameters that can be configured by the user. A workflow is built by putting a collection of modules together, to achieve a desirable function.
The list of modules available depends on the packages that were loaded by the user. They appear on the left side of the builder, and when the builder is in "pipeline" mode, modules can be dragged from the left, and placed into the workflow. Once modules have been moved, their inputs and outputs can be connected, as long as they have appropriate types.
To change the parameters of a module, first one needs to click on the module. Once that is done, all the methods that can set module parameters will appear on the panel on the right. After the user has determined the method that they want to use, you need to drag the method to the "Properties" panel, which is directly below the "Methods" panel. At this point, you can select the text edit boxes in the panel and type in a value. The labels to the left of each text edit box indicate the parameter input type (double – number with a decimal point or int – whole number) and the name of the parameter. When a module is changed, a new instance of the workflow with the changed parameters is added to the vistrails. (If PIP is turned on, you will see the change immediately in the version tree.)
Using the VisTrails Version Tree
As you make changes to the modules of a workflow, the instances are automatically added to the vistrail. This allows you to go back to a previous version (higher up in the tree), and use a different set of parameters to modify the data without losing any of the changes you have already made.
It is possible to build a very large number of different versions quite quickly with the system. In order to help the user, the system provides a number of different ways of what workflows to show in the version tree. The default is to only show "named" workflows, or the ones that are at the leaves. All other ones are collapsed by default.
To name a workflow, you need to select it while in Version Tree mode. When that is done, the panel on the right will have a "Version Tag" text box that can be used for naming the workflow. You need to type in a name for the module and select the Change button to the right. This will place that name in the selected workflow in the version tree.
Working With Modules
Modules are connected with lines that represent dataflow connection between modules. Modules can be connected or disconnected, and added or deleted from a workflow.
To see how this works, we will change the original data from the vtkQuadric module to a vtkCylinder module in the workflow labeled "final" in the vtk_book_3rd_p189.xml vistrail.
Creating a New Module
Since there are literally 100s of modules, the easiest way to find the module we want is to search for it. On the left panel, where all the modules are listed, there is a "Search" text box on top. As you type "vtkcyli", the system will automatically filter the modules, and at one point, you will be able to see the vtkCylinder module. Alternatively, you could have searched for the module by actually looking at the modules one by one. You can now drag the module to the pipeline.
Creating a Dataflow From Modules
To change the data source from vtkQuadric to vtkCylinder, you need replace the output of the first with the second. Notice that the line connecting each of the modules starts and ends in a small box at the top or bottom of the modules.
To disconnect the vtkQuadric output from vtkSampleFunction, you can select the connection line, and delete it.
To connect the vtkCylinder output to the vtkSampleFunction input, place the cursor over the small box in the lower right corner of the vtkCylinder module, click and hold down the mouse button. Drag the cursor away from vtkCylinder and a line will appear. Drag the end of the line to the left most small input box in the upper left corner of the vtkSampleFunction module and release the mouse button. The line now connects vtkCylinder and vtkSampleFunction.
To check that you were successful, just execute the pipeline, and the result should appear on the spreadsheet. The data in the cell shows a series of cylindrical shapes.
The input ports of the module will only accept connections from correct output ports. Dropping a connection on a module will cause it to snap to the nearest appropriate port. However, when a module accepts multiple ports of the same type, care must be take as to how the connection is made. The easiest way to ensure proper connectivity is to begin the connection at the module with multiple ports of the same type and drag it to the appropriate endpoint. To determine the exact port to begin at, simply hover the mouse cursor over the port to query and a small note will be displayed with information about the port in question.
Accessing Module Parameters
You will notice that when you select the vtkCylinder component in the visualization panel on the left, there are no parameters to adjust in the lower right panel on the right. Only the parameters that have been modified by the user are displayed to prevent clutter.
To modify a parameter from its default setting, clickon the word SetRadius and continue to hold down the mouse button. SetRadius becomes highlighted. With the mouse button still held down, drag the cursor to the "Properties" panel directly below. A parameter text edit box is shown for SetRadius. You can enter a new radius size for the vtkCylinder component.
VisTrails Spreadsheet
Advanced Topics
VisTrails Packages
Examples
Working with Web Services and HTML (updated for version 1.0)
In this example, we will build a very simple pipeline that invokes a web service and publishes its results on a html page. The web services we will use are provided by the Chemical Informatics and Cyberinfrastructure Collaboratory (CICC) at Indiana University.
Enabling the webServices Package
The first thing we need to do after starting VisTrails is to enable the webServices package on the Preferences pane.
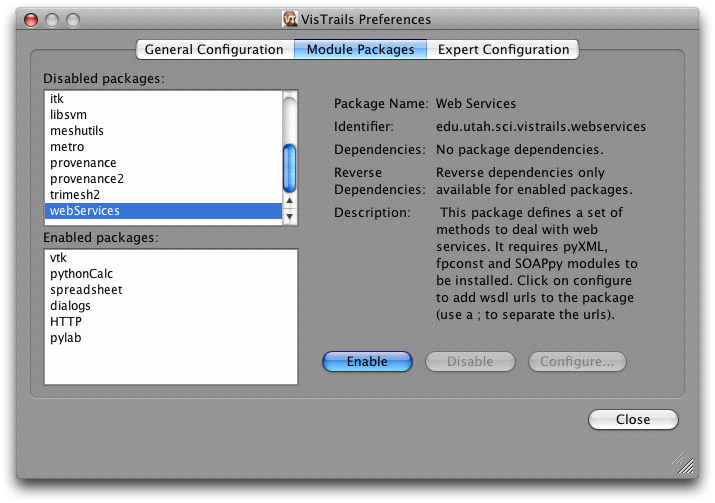
Open the Preferences panel (on Windows and Linux, it is located under the Edit menu, and on Mac, it is under the VisTrails menu), and select the tab named Module Packages (see Figure below).
On the Disabled packages list, select webServices and click on Enable.
Now select webServices on the Enabled packages list and click on Configure. A new window will appear and you will be able to add a ;-separated list of web services urls. Select wsdlList and click on the Value field. You can type the web services urls you want. For our example, we need the following two urls:
http://rguha.ath.cx:8080/pws/services/Structure?wsdl;
http://rguha.ath.cx:8080/cdkws/services/StructureDiagram?wsdl
Click on Close. Then you are required to disable and enable the package again so the urls can be loaded. After that, close the Preferences window.
Creating a new vistrail
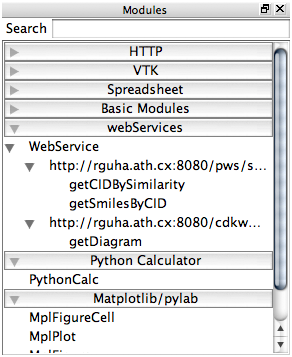
After configuring the webServices package properly, you will see that there will be a tab webServices in your Modules panel (see Figure below).
The webServices package will generate a module for each published method in a web service. If you do not already have a new vistrails open, that is the right time to create a new one.
Adding Modules to the Pipeline
At this point, we should start adding modules to our workflow.
If you have the web services list visible in
your Modules panel, click on getSmilesByCID and drag it to
the Pipeline view area. Otherwise, use the search
capability: in the Search field of the
Modules panel (the leftmost pane of the Builder Window),
type in getSmilesByCID. You will notice that a module under
the webServices branch will be selected. Now you can add it by
clicking-and-dragging it over the Pipeline view area
represented by the darker grey canvas on the Builder Window. This
module gets the SMILES (Simplified Molecular Input Line Entry System. Specification for unambiguously describing the structure of chemical molecules using short ASCII strings) corresponding to a
compound ID. We need to add more modules that will process the output
provided by the getSmilesByCID module, including another
web service module that will obtain the 2D diagram of the compound. In
the same way described above, add the following modules (the number in
parenthesis represents the number of modules you should add):
- PythonSource (2)
- getDiagram (1)
- RichTextCell (1)
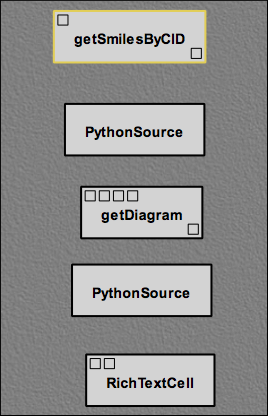
After adding these modules, your workflow should be similar to the one shown below.
The modules were added to the pipeline view, but remain
unconnected. This is a good point for us to save our work. First we
will name this pipeline as modules. To do that, we need to switch to
the version tree view by selecting the Version Tree tab
in the top pane on the right of the buider window. In the
Version Tag field type in modules and click on
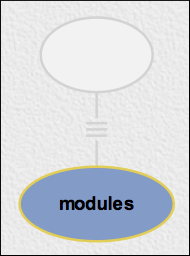
change. Your version tree should now look similar to this:
Now we save our work by clicking on the Save button (the third from left to right on the Builder Toolbar) or pressing Ctrl+S (Command + S on Mac). Give a name to your file, such as chembiogrid_webservice.xml. Then we can go back to the pipeline view by selecting the Pipeline tab.
Module customization and parameterization
Each module box has a set of input ports, located in the upper-left hand corner of the box, and a set of output ports, located in its lower-right hand corner. They will be used to pipe data between modules. You may have noticed that the PythonSource module does not contain any input or output port. This module is designed to contain any piece of Python code. So we, as pipeline builders, must define the input and the output ports and include the piece of code to manipulate the inputs and generate outputs. We are going to use this module to process data between the web services and to create our html page.
First, open the configuration window of the top most PythonSource module by clicking on the arrow on the top-right corner of the module box and select Edit Configuration.
Add one input port, data of type String (the
same output type of getSmilesByCID module) and add an
output port called smiles also of type String
(the same input type of getDiagram).
Now type the following code in the text area and click OK when you are done:
smiles = data[0]
The getSmilesByCID module returns an array of strings
encoded in a String object. The getDiagram module, on the
other hand, expects a single smiles. So we need to extract
only one element of the array and pipe it through the
getDiagram module (later you can add another output port
and pipe the other smiles to another getDiagram module.
Now we will customize the other PythonSource. Open its
Configuration Window and add an input port,
diagram of type String (the same output type of the
getDiagram module). Also, add an output port, htmlFile of
type File and type the following piece of code in the text
area:
 import base64
 image = base64.decodestring(diagram)
 f = self.interpreter.filePool.create_file(".jpg")
 my_file = open(str(f.name), 'wb')
 my_file.write(image)
 my_file.close()
 text = '<HTML><TITLE>Compound Summary</TITLE><BODY BGCOLOR="#FFFFFF">'
 text += '<TABLE WIDTH="100%" BORDER="1" BGCOLOR="#FFFFFF" %CELLPADDING="4">'
 text += '<TR><TD VALIGN="TOP"><P><IMG SRC="'
 text += f.name + '"></TD>'
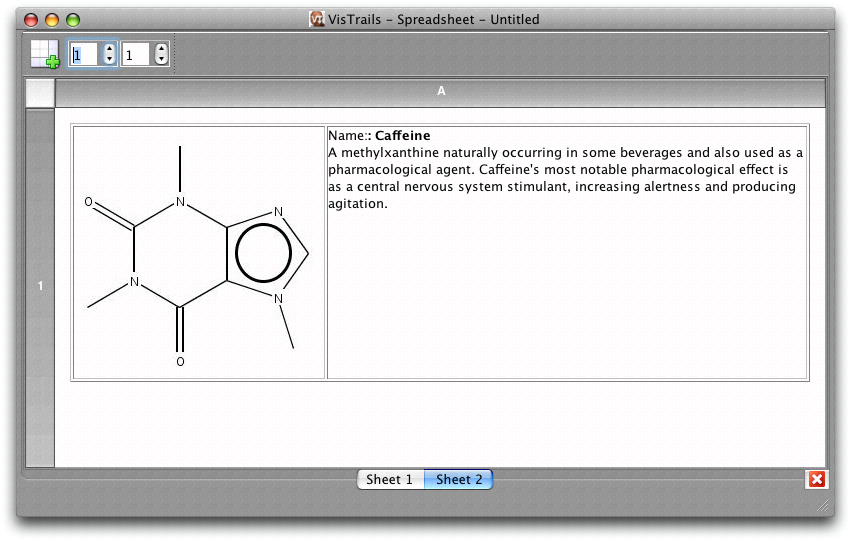
 text += '<TD>Name:<B>: Caffeine </B><BR>'
 text += "A methylxanthine naturally occurring in some beverages and "
 text += "also used as a pharmacological agent. Caffeine's most notable "
 text += "pharmacological effect is as a central nervous system stimulant,"
 text += " increasing alertness and producing agitation.</TD></TR></TABLE>"
 output = self.interpreter.filePool.create_file()
 my_file = open(str(output.name), 'w')
 my_file.write(text)
 my_file.close()
 self.setResult("htmlFile",output)
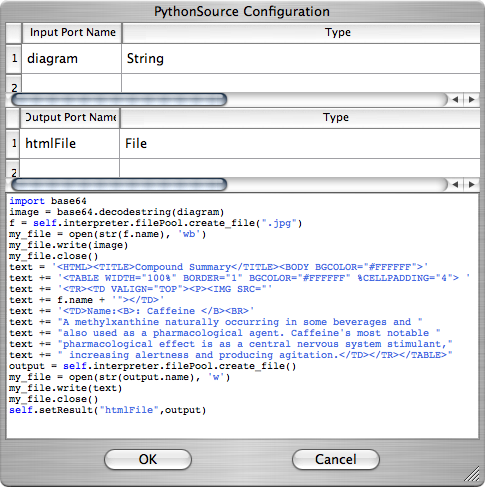
The PythonSource Configuration Window should look similar to the one shown below:
We also need to set a few parameters in order to getSmilesByCID to work properly. getSmilesByCID receives a compound ID. Caffeine's CID is 2519.
The \vtmodule{getDiagram} also needs parameters to be set. Provide the following values: height: 250, width: 250, and scale: 1.0.
Let's give the name parameters set to this
pipeline. Repeat the steps we performed above to change a version tag
and save your pipeline.
Connecting modules
Now that we have all the modules necessary to process our data, we must connect them properly to fully form our processing pipeline. Each module box has a set of input ports, located in the upper-left hand corner of the box, and a set of output ports, located in its lower-right hand corner. In order to connect two modules together, click-and-drag the appropriate output box contained in the module to the module using it as its input. For modules that have more than one input/output, you can see the type of each individual port when hovering the mouse (as a tooltip). VisTrails will also snap a connection to matching ports.
So, for example, by clicking and dragging the output port of the getSmilesByCID module to the input port of PythonSource module, a connection will be made between the two modules. This connection is indicated by a solid black line. Now we must continue connecting our pipeline. Add the following connections in the same way described above:
- The output port of PythonSource to the input port
smilesof getDiagram - The output port of getDiagram to the input port of PythonSource
- The output port of PythonSource to the input port
Fileof RichTextCell
Name this version connections and you are ready to execute
this pipeline.
Executing the workflow
The workflow is now ready to be visualized. As we have a RichTextCell module, pressing the Execute current pipeline button will send the current pipeline with the current parameters to the VisTrails Spreadsheet, resulting on an image similar to the one below.
You may also want to download the vistrails file corresponding to this example.
