| EFE Diagram |
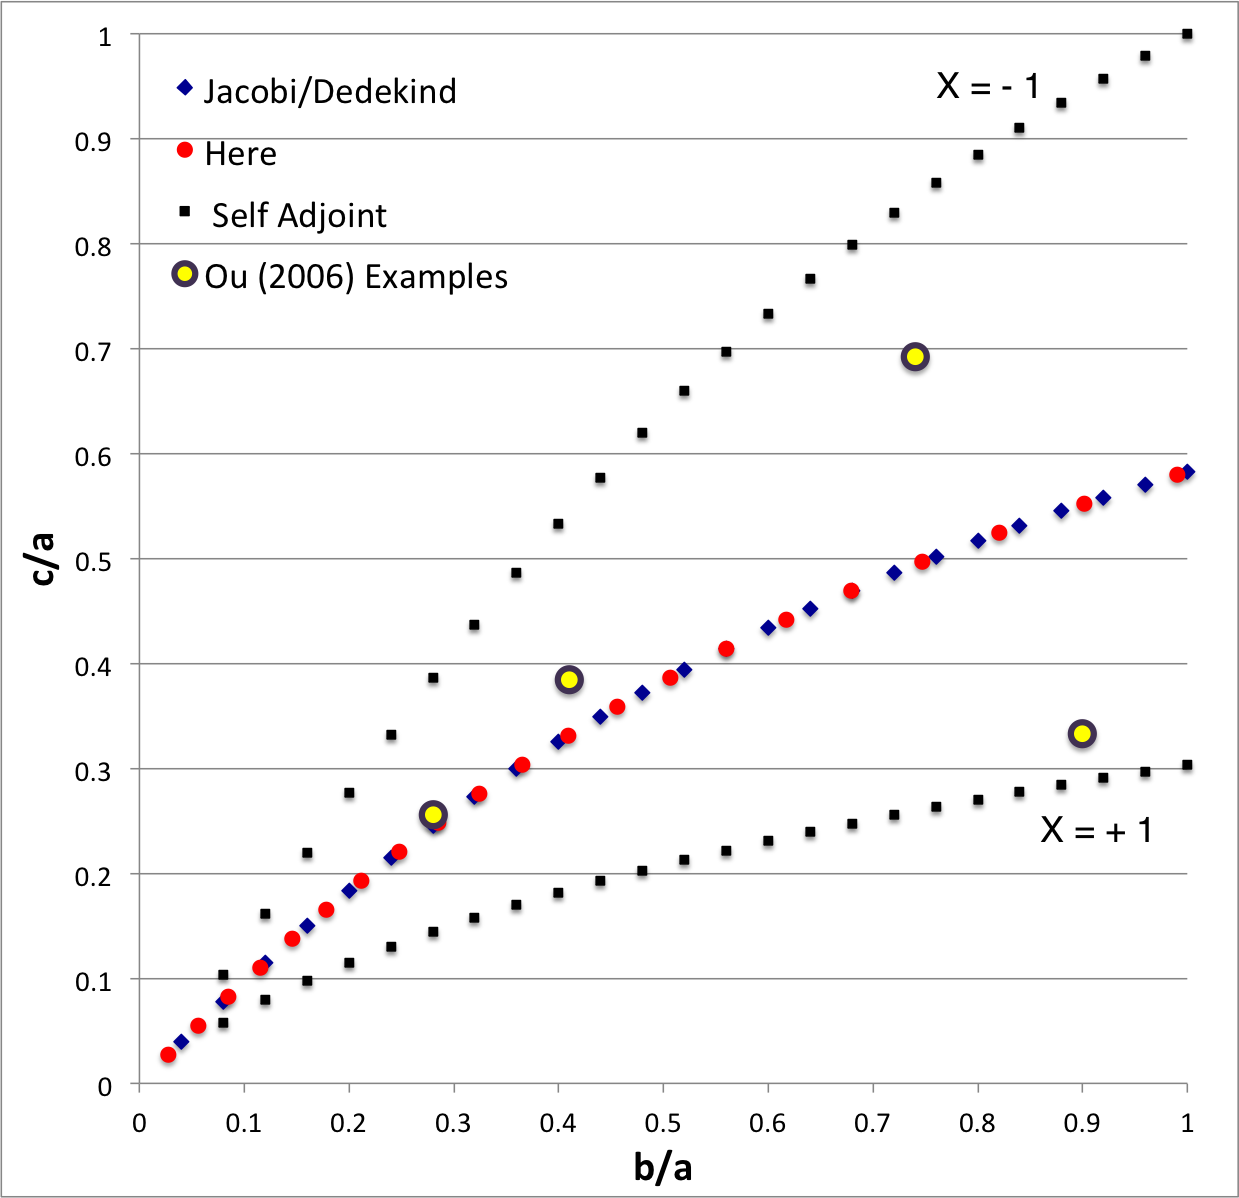
In the context of our broad discussion of ellipsoidal figures of equilibrium, the label "EFE Diagram" refers to a two-dimensional parameter space defined by the pair of axis ratios (b/a, c/a), usually covering the ranges, 0 ≤ b/a ≤ 1 and 0 ≤ c/a ≤ 1. The classic/original version of this diagram appears as Figure 2 on p. 902 of S. Chandrasekhar (1965, ApJ, vol. 142, pp. 890-921); a somewhat less cluttered version appears on p. 147 of Chandrasekhar's [EFE].
The version of the EFE Diagram shown here, on the left, highlights four model sequences, all of which also can be found in the original version:
- Jacobi sequence — the smooth curve that runs through the set of small, dark-blue, diamond-shaped markers; the data identifying the location of these markers have been drawn from §39, Table IV of [EFE]. The small red circular markers lie along this same sequence; their locations are taken from our own determinations, as detailed in Table 2 of our accompanying discussion of Jacobi ellipsoids. All of the models along this sequence have <math>~f \equiv \zeta/\Omega_f = 0</math> and are therefore solid-body rotators, that is, there is no internal motion when the configuration is viewed from a frame that is rotating with frequency, <math>~\Omega_f</math>.
- Dedekind sequence — a smooth curve that lies precisely on top of the Jacobi sequence. Each configuration along this sequence is adjoint to a model on the Jacobi sequence that shares its (b/a, c/a) axis-ratio pair. All ellipsoidal figures along this sequence have <math>~1/f = \Omega_f/\zeta = 0</math> and are therefore stationary as viewed from the inertial frame; the angular momentum of each configuration is stored in its internal motion (vorticity).
- The X = -1 self-adjoint sequence — At every point along this sequence, the value of the key frequency ratio, <math>~\zeta/\Omega_f</math>, in the adjoint configuration <math>~(f_+)</math> is identical to the value of the frequency ratio in the direct configuration <math>~(f_-)</math>; specifically, <math>~f_+ = f_- = -(a^2+b^2)/(ab)</math>. The data identifying the location of the small, solid-black markers along this sequence have been drawn from §48, Table VI of [EFE].
- The X = +1 self-adjoint sequence — At every point along this sequence, the value of the key frequency ratio, <math>~\zeta/\Omega_f</math>, in the adjoint configuration <math>~(f_+)</math> is identical to the value of the frequency ratio in the direct configuration <math>~(f_-)</math>; specifically, <math>~f_+ = f_- = +(a^2+b^2)/(ab)</math>. The data identifying the location of the small, solid-black markers along this sequence have been drawn from §48, Table VI of [EFE].
Riemann S-type ellipsoids all lie between or on the two (self-adjoint) curves marked "X = -1" and "X = +1" in the EFE Diagram. The yellow circular markers in the diagram shown here, on the left, identify four Riemann S-type ellipsoids that were examined by Ou (2006) and that we have also chosen to use as examples.
|


