CORIE/ERF 2007
Jump to navigation
Jump to search
|
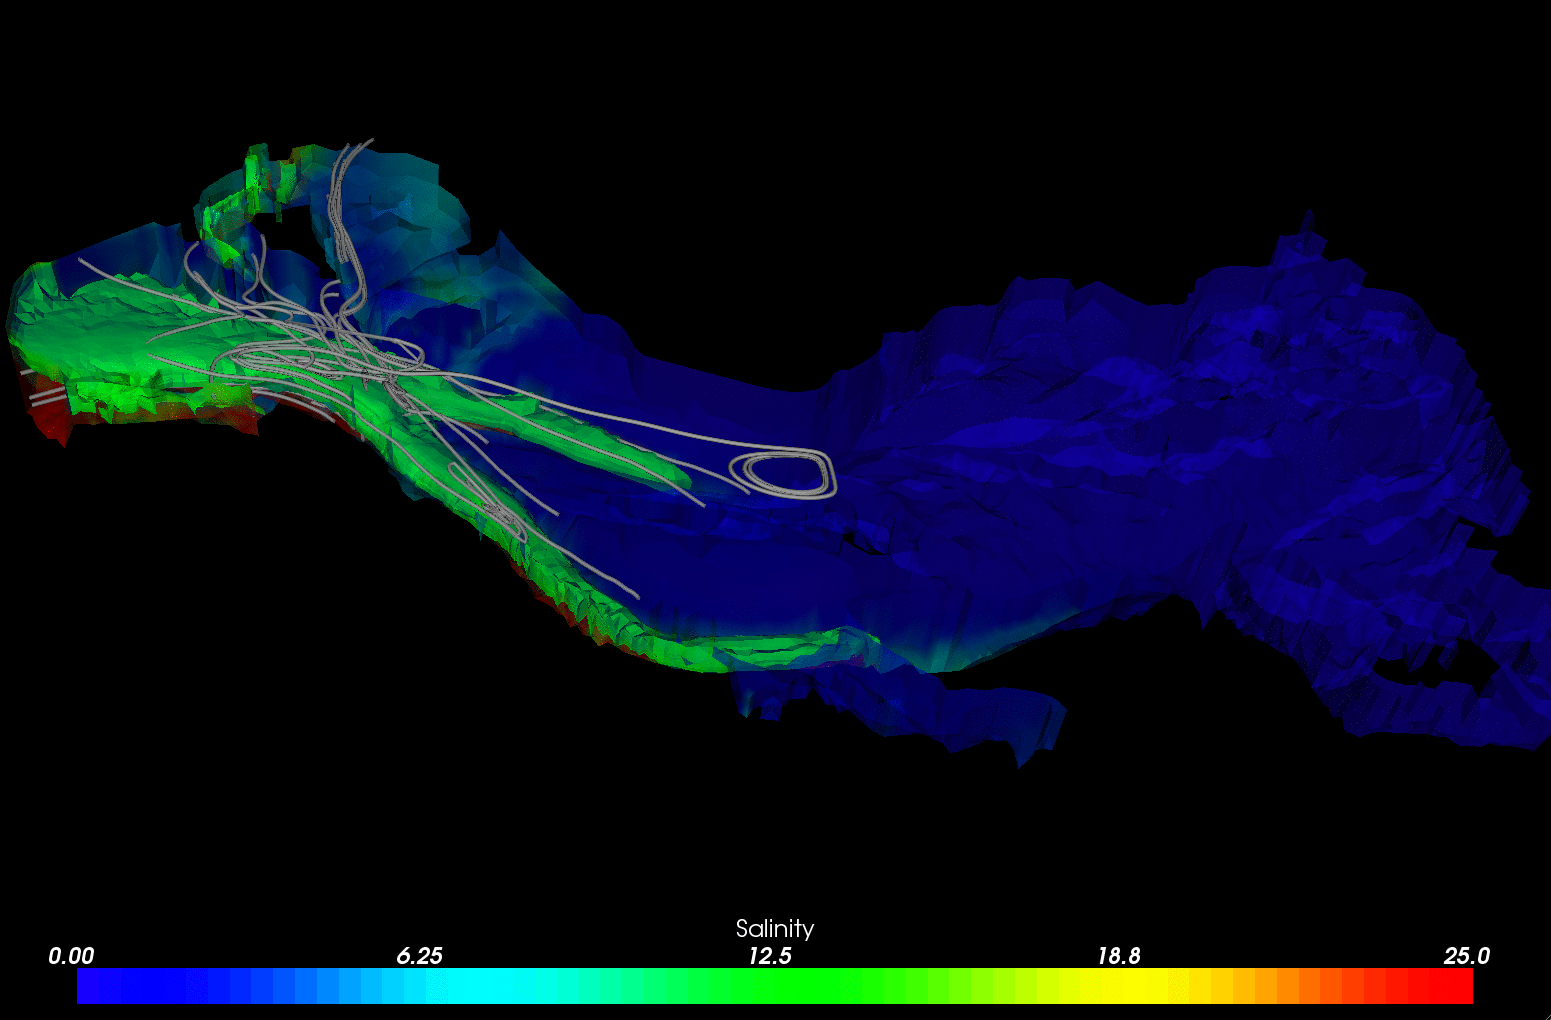
This animation is a rendering of 88 of the 96 timesteps from the CORIE dataset on day 7. The gray salt-flux streamlines are formed from a hidden seed plane and propagated until they terminate (not termination by propagation time). The streamlines reflect the dimensionality of the input data. (i.e. the vector field is a stack of 2-D vectors, not a 3-D vector volume) The overall input volume is rendered with low opacity to highlight the iso-surface embedded in it. This iso-surface, 12.5, represents the mid-point of the salinity field being rendered (min = 0, max = 25). You can see that as the seawater movies into and out of the inlet, the streamlines often exhibit a period of circular motion (vorticity?) and the salt-flux clearly is moving with the tides.
The complete animation is available here: corie_streamline_animation |
|
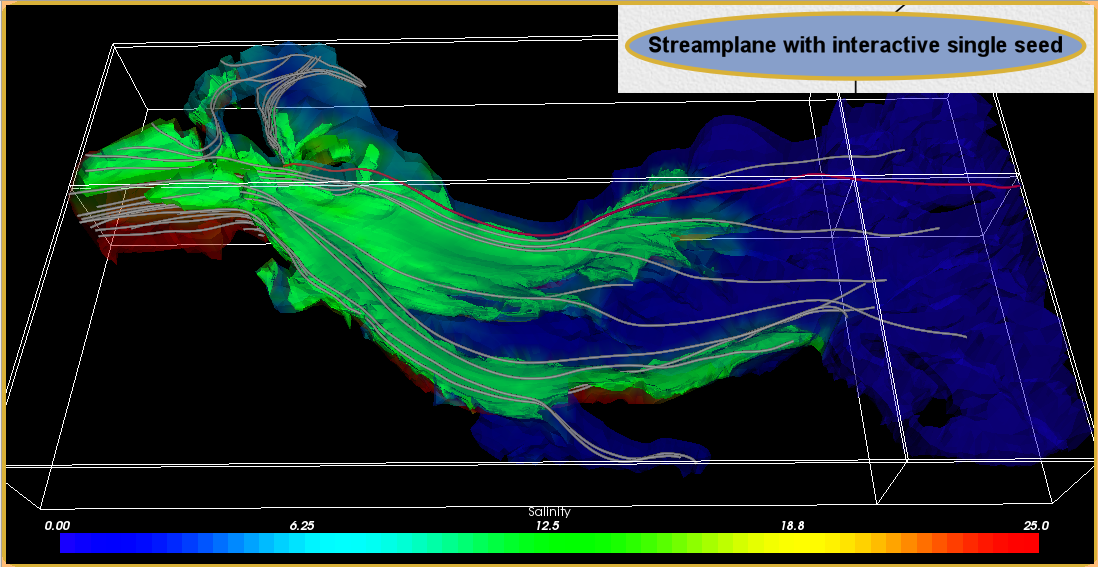
Drawing from the above animation, this image draws a single salt-flux streamline defined by the interactive user-input seedpoint. This single streamline is drawn in red to give it contrast against the other streamlines drawn by the (hidden) seeding plane used to generate the grey lines. |
|
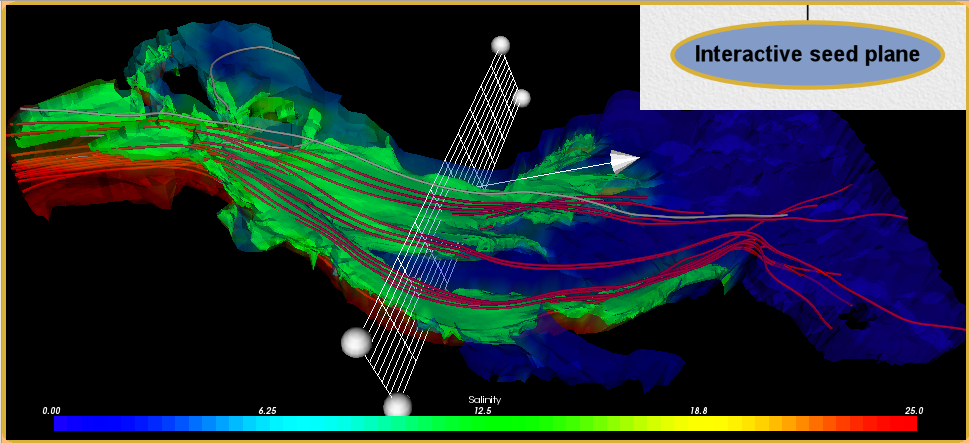
By modifying the vistrail used to generate the above image, we produced a rendering in which the user specifies an interactive seed plane. This plane can be moved (translated), scaled, and rotated to generate various numbers of streamlines. The seed points exist only at the grid points defined on the plane.
Here is an animation (in Quicktime) of the interaction interactive_plane |
|
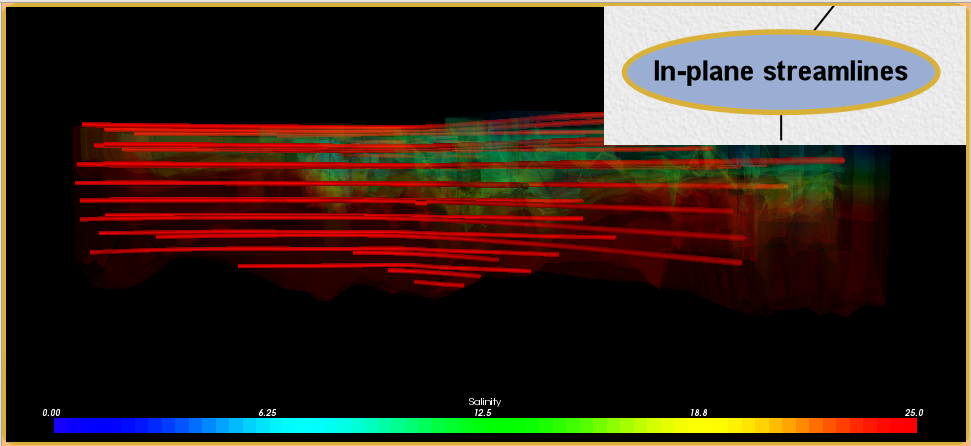
This rendering illustrates the nature of the salt-flux vector field. After inspect the source, it seems that the vector field is not a volume of 3D vectors, but a volume composed of 2D vectors (z component = 0) and thus, the streamlines never leave the plane in which they were generated. |
|
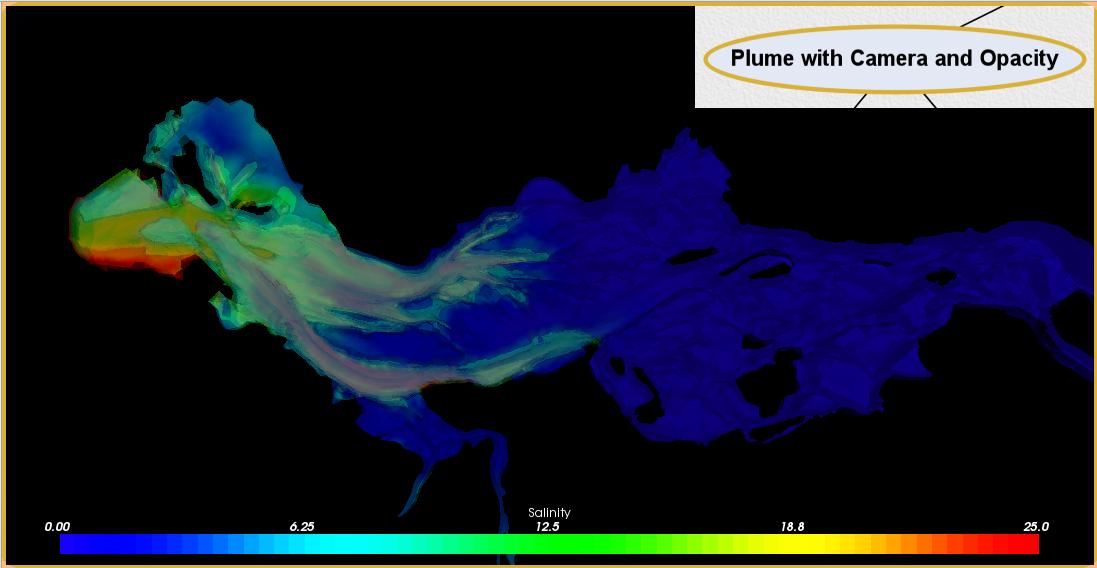
This rendering uses not a single iso-surface in the salinity field, but 3. This highlights not just the influx of saltwater into the inlet, but the depths at which the water is moving. The coloring of the final rendering (with proper depth-sorting) illustrates that the saltier water flows underneath the freshwater. |