Difference between revisions of "Main Page"
(→News) |
|||
| Line 2: | Line 2: | ||
== News == | == News == | ||
* UV-CDAT 1.0.0 has been released. You can find detailed information at http://uvcdat.llnl.gov | |||
* Check out the new Software for Assisted Habitat Modeling (SAHM) package for VisTrails at http://www.mesc.usgs.gov/products/software/sahm/. SAHM was developed by [http://www.mesc.usgs.gov/Staff/staffprofile.asp?StaffID=1001 Jeff Morrisette's] group at the USGS. [http://www.fort.usgs.gov/Staff/staffprofile.asp?StaffID=518 Colin Talbert] is responsible for much of the code including the VisTrails wrapping. The package expedites habitat modeling and help maintain a record of the various input data, pre- and post- processing steps, and modeling options incorporated in the construction of a species distribution model. | * Check out the new Software for Assisted Habitat Modeling (SAHM) package for VisTrails at http://www.mesc.usgs.gov/products/software/sahm/. SAHM was developed by [http://www.mesc.usgs.gov/Staff/staffprofile.asp?StaffID=1001 Jeff Morrisette's] group at the USGS. [http://www.fort.usgs.gov/Staff/staffprofile.asp?StaffID=518 Colin Talbert] is responsible for much of the code including the VisTrails wrapping. The package expedites habitat modeling and help maintain a record of the various input data, pre- and post- processing steps, and modeling options incorporated in the construction of a species distribution model. | ||
* There is another bug-fix release of VisTrails 2.0 beta available for download from the [[Downloads]] page. | * There is another bug-fix release of VisTrails 2.0 beta available for download from the [[Downloads]] page. | ||
Revision as of 00:36, 13 May 2012
Download
News
- UV-CDAT 1.0.0 has been released. You can find detailed information at http://uvcdat.llnl.gov
- Check out the new Software for Assisted Habitat Modeling (SAHM) package for VisTrails at http://www.mesc.usgs.gov/products/software/sahm/. SAHM was developed by Jeff Morrisette's group at the USGS. Colin Talbert is responsible for much of the code including the VisTrails wrapping. The package expedites habitat modeling and help maintain a record of the various input data, pre- and post- processing steps, and modeling options incorporated in the construction of a species distribution model.
- There is another bug-fix release of VisTrails 2.0 beta available for download from the Downloads page.
- You can now learn how to use the SAHM Package for VisTrails. Check out the new tutorial for the Software for Assisted Habitat Modeling (SAHM) package in VisTrails, by N. Young.
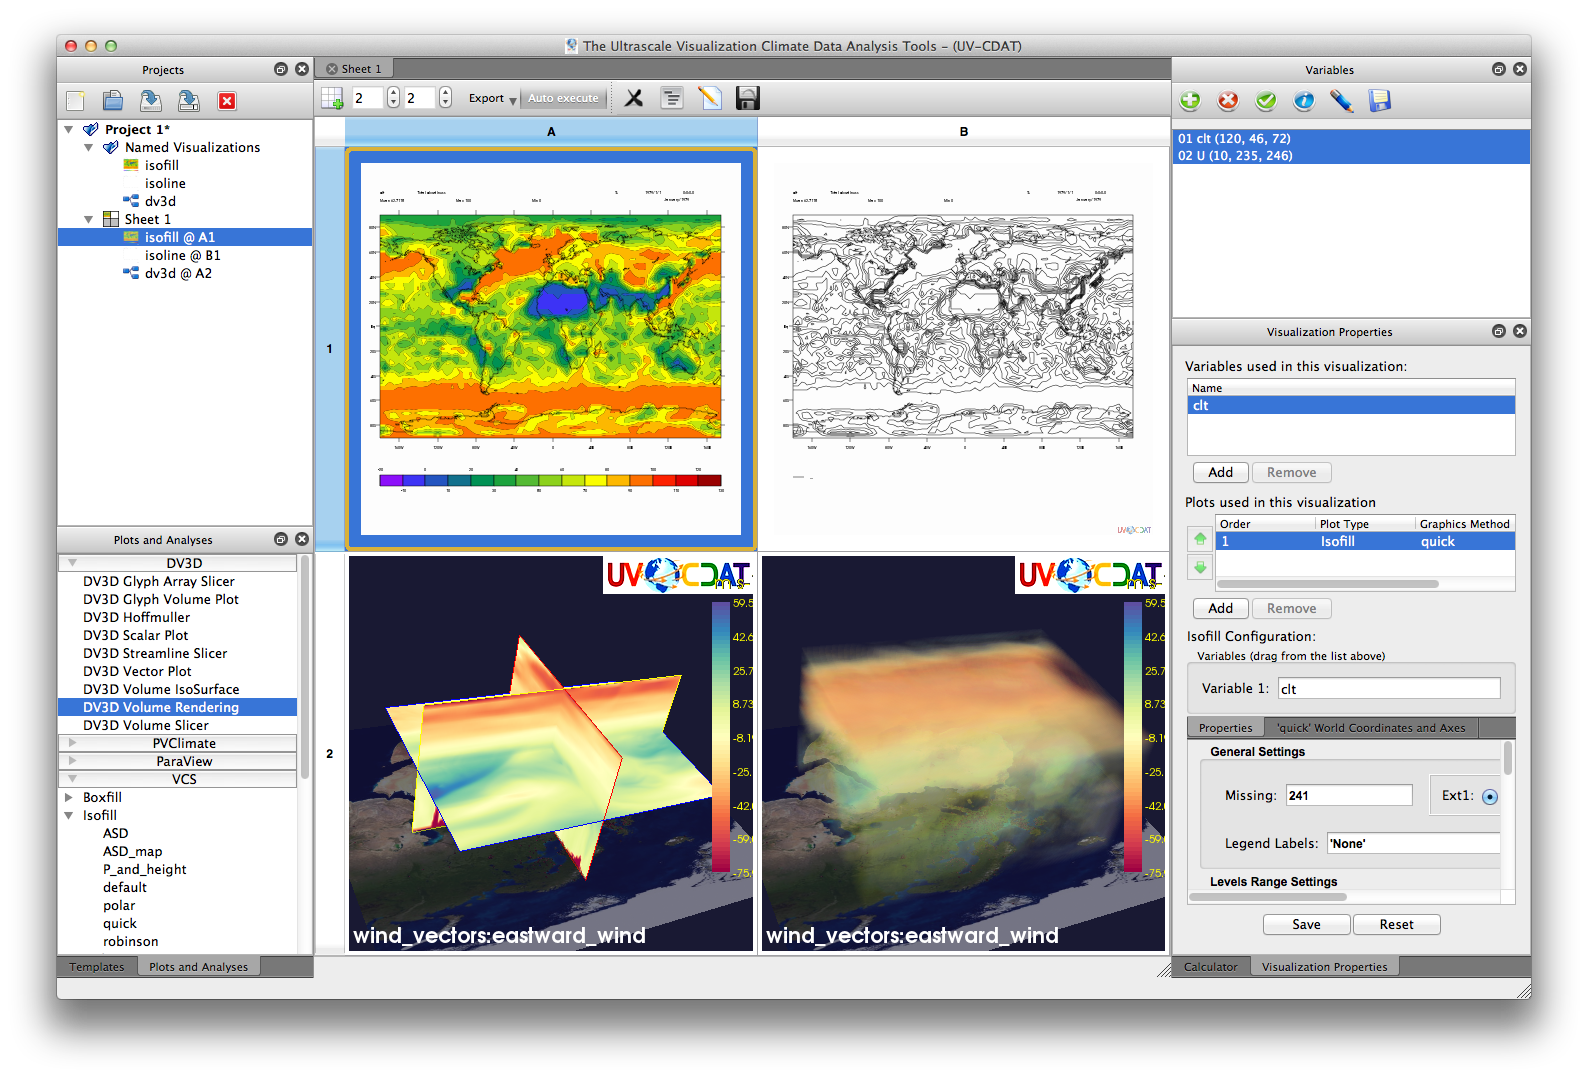
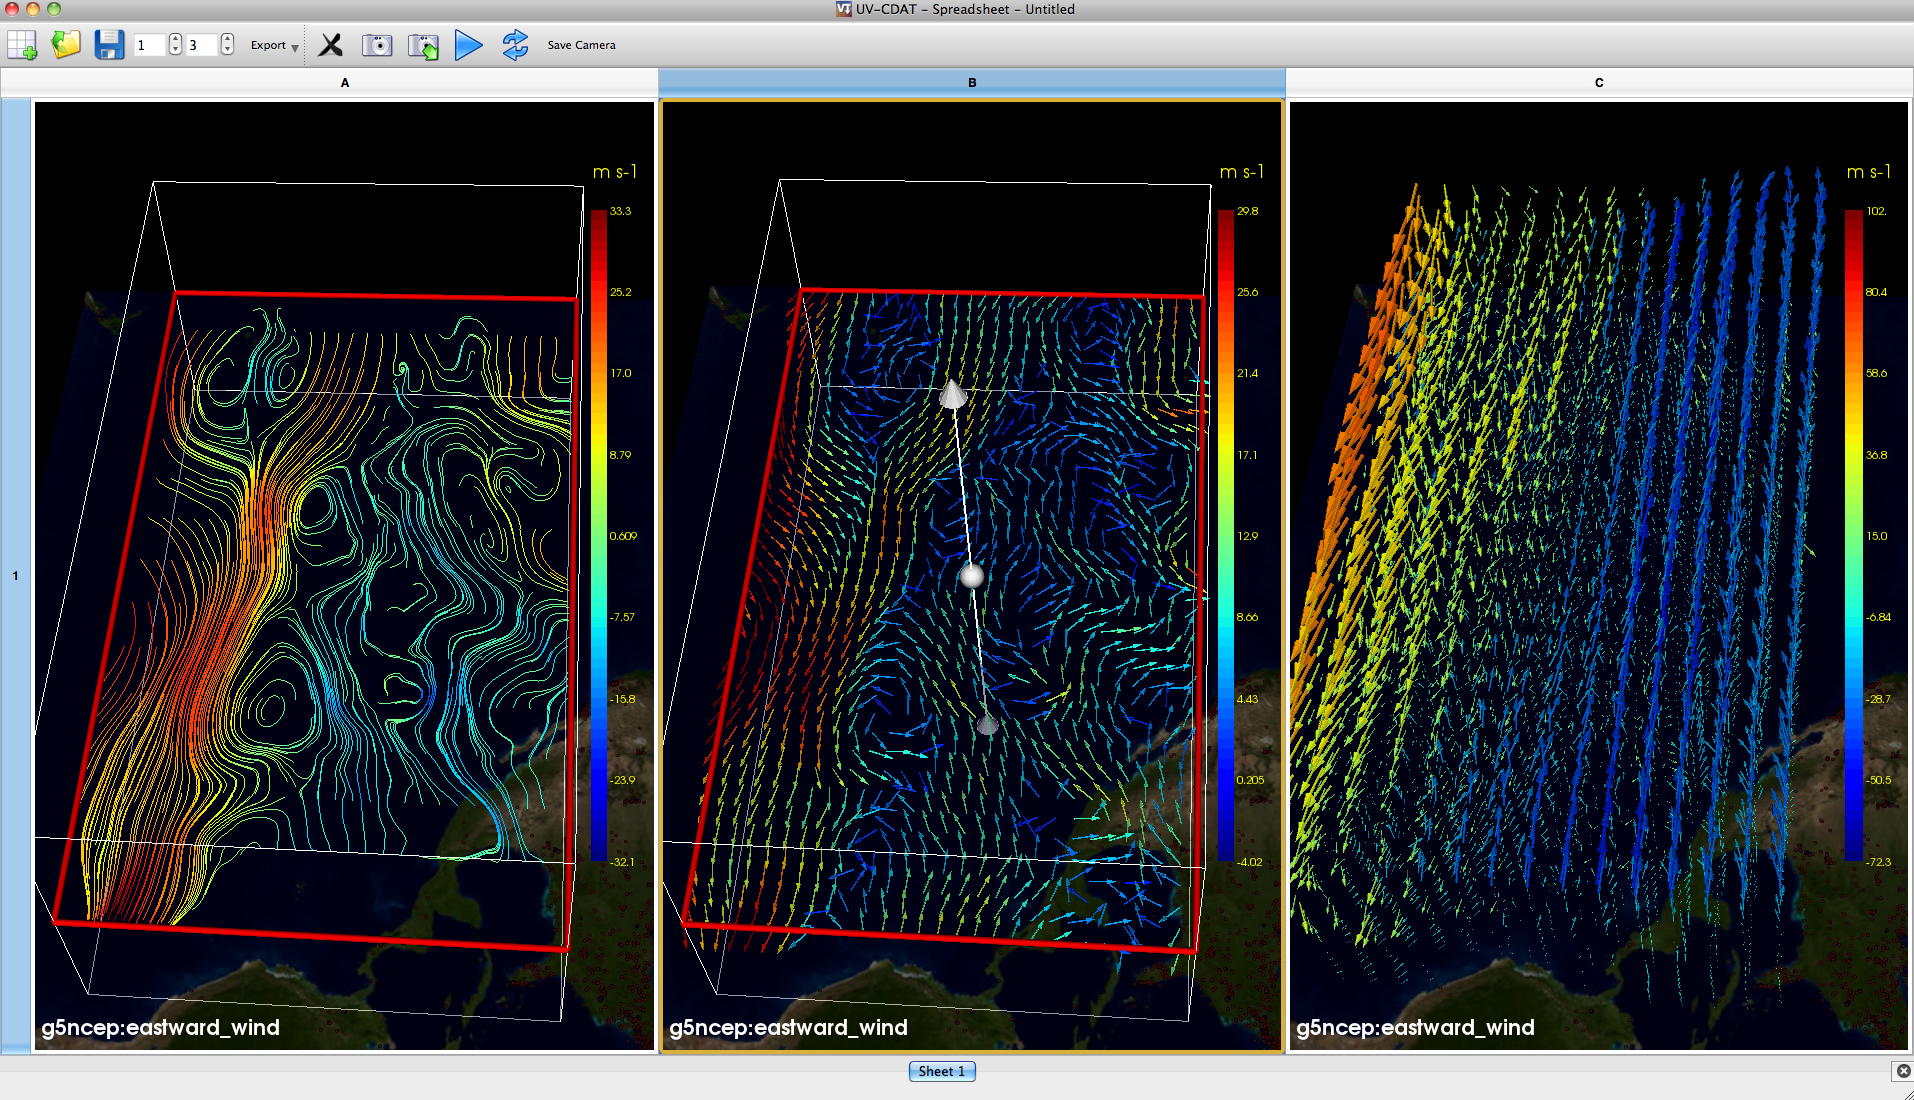
- The beta version of UV-CDAT has been released, on the right is a screenshot of what it looks like.
- You can find video tutorials at http://uv-cdat.llnl.gov/wiki/VideoTutorials
- For more info on UVCDAT see: http://uv-cdat.llnl.gov. You can find both binaries (Mac/RedHAT6/Ubuntu) or build-from-sources options at: http://uv-cdat.llnl.gov/install/
- Please keep in mind this is an alpha release, please report issues you encounter with the build/GUI/command line via bugzilla at: http://uv-cdat.llnl.gov/bugzilla/
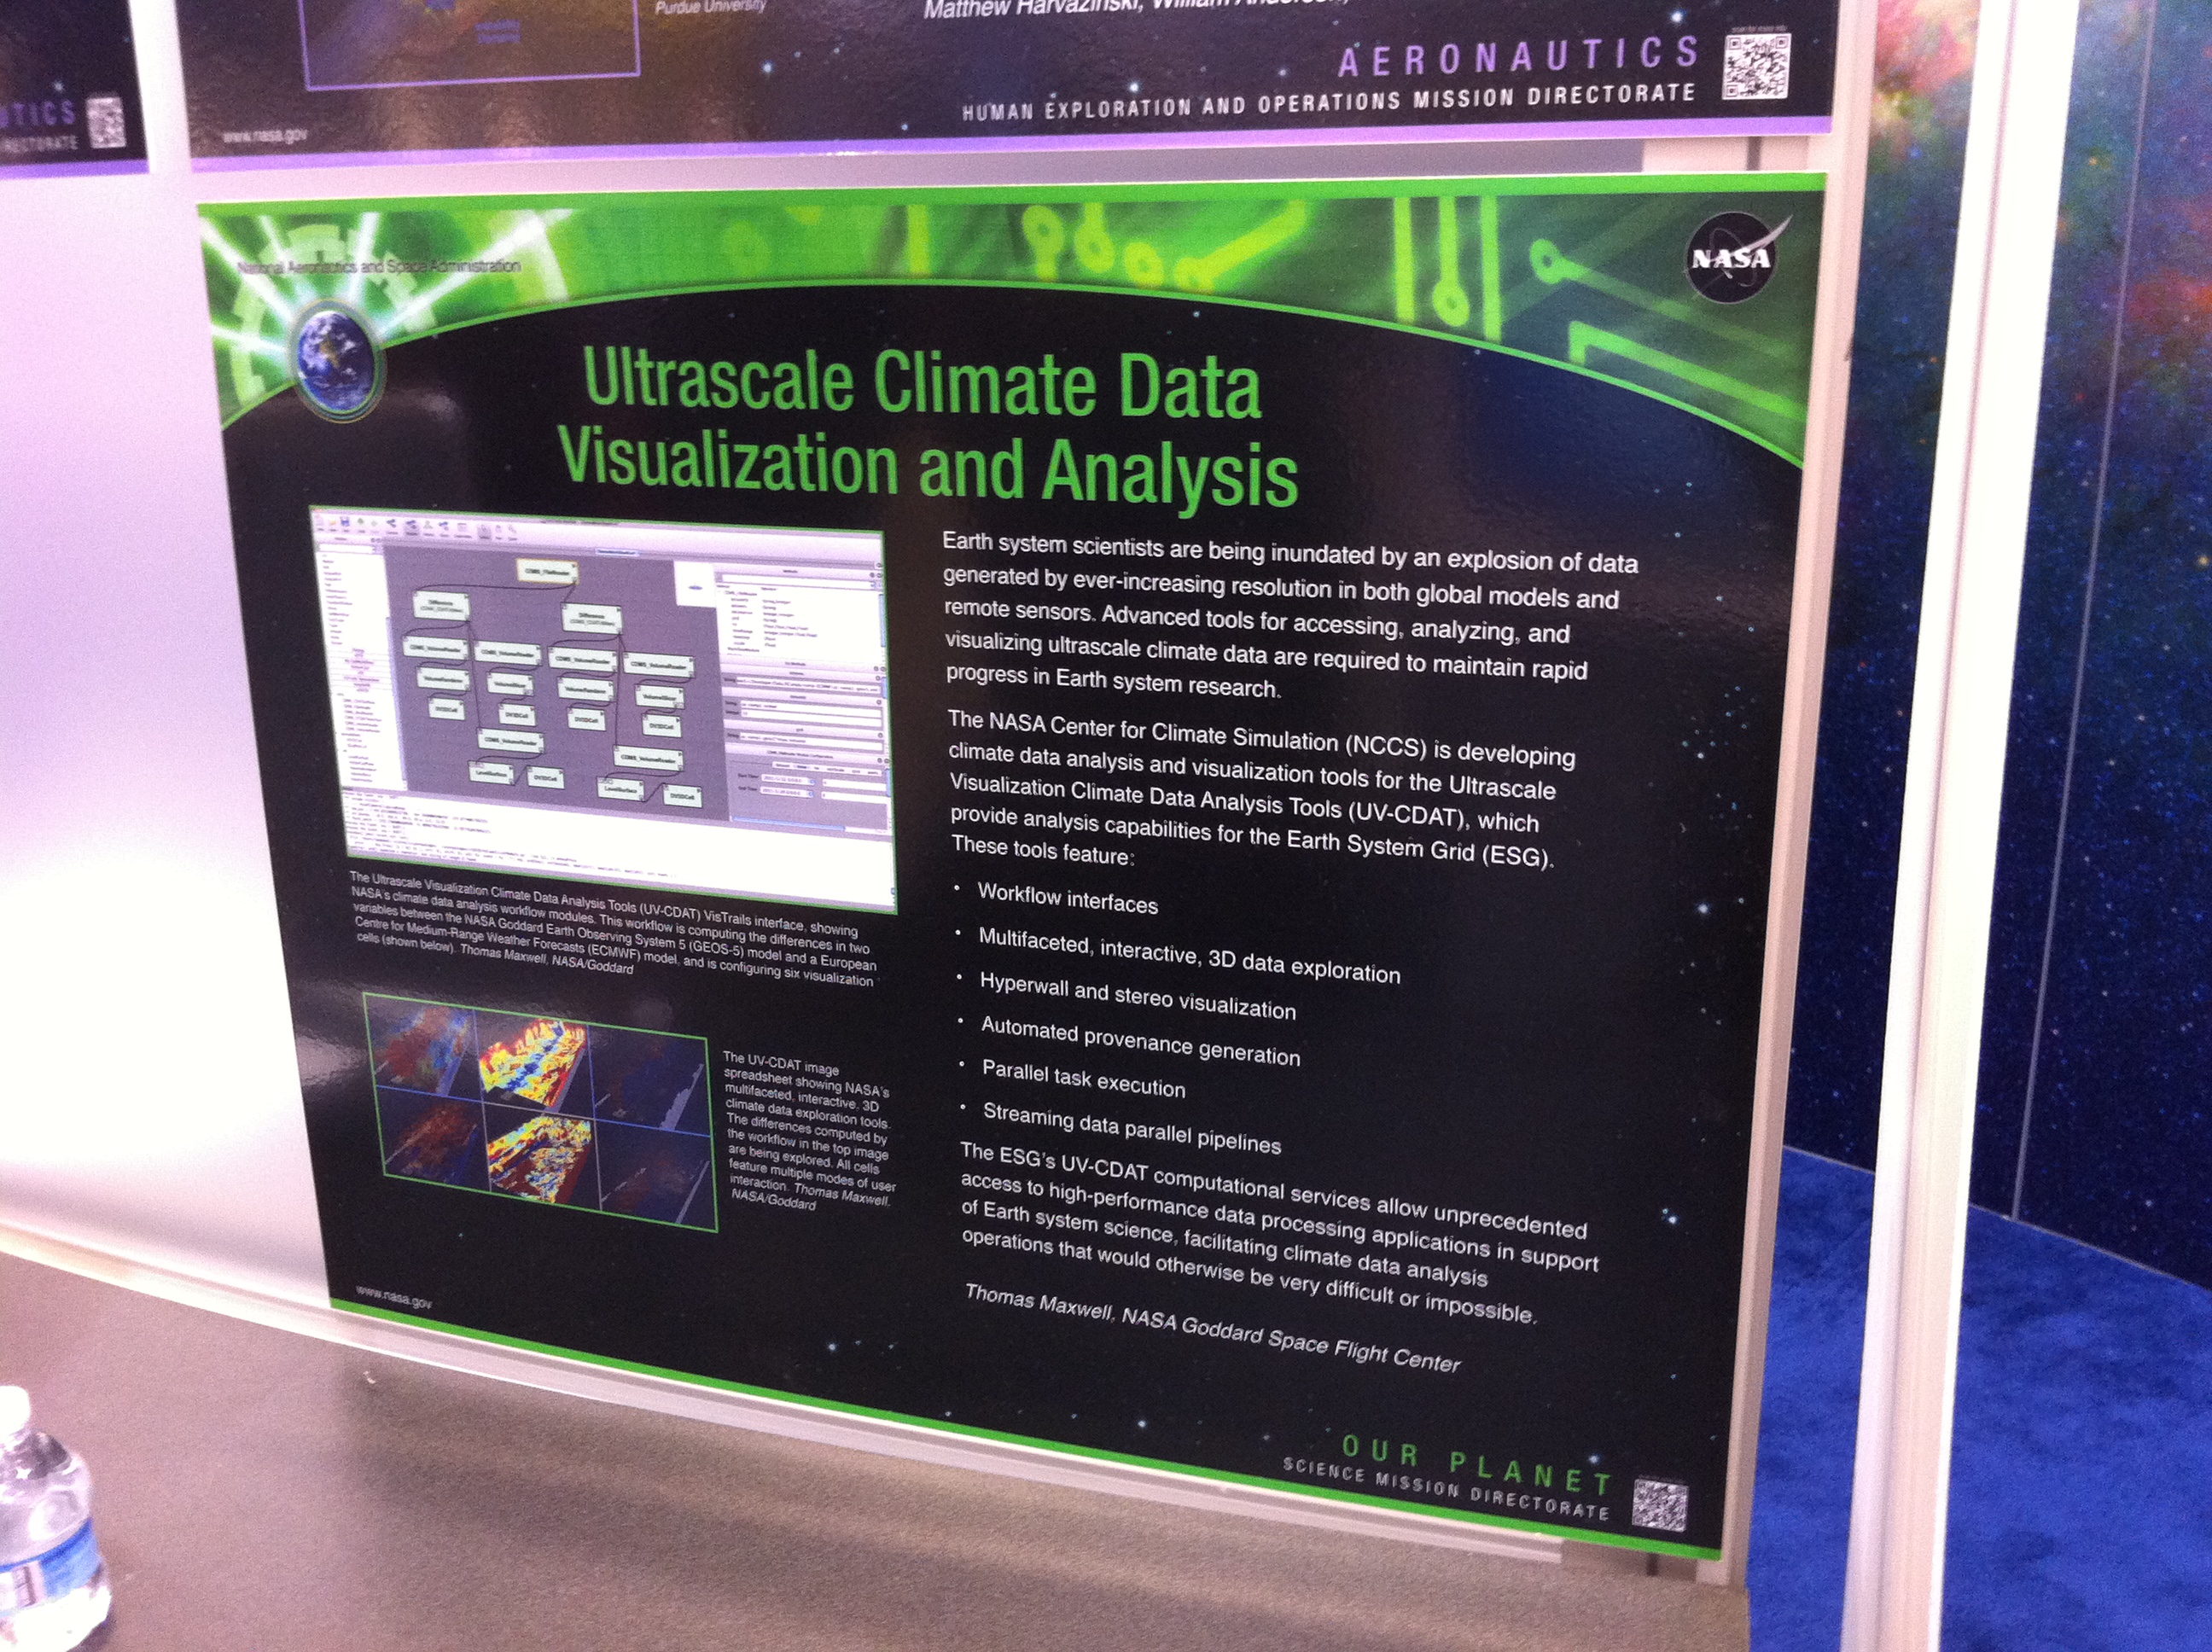
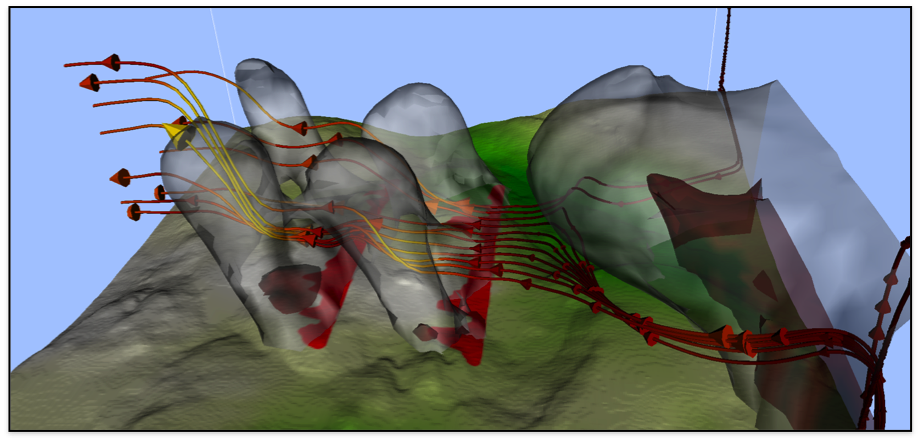
- Thomas Maxwell (NASA) has demoed his UV-CDAT package, vtDV3D at SC11. UV-CDAT is a new system for climate data analysis that combines VisTrails, CDAT and ParaView.
- The VisTrails 2.0 alpha has been released and it is available for download from http://www.vistrails.org/index.php/Downloads. VisTrails is now distributed under the BSD license and its GUI was completely re-designed to make it easier to manage and interact with multiple workflows. It also includes a much improved Users' Manual. Some notable features include:
- the ability to create mashups;
- support for the creation of reproducible papers;
- a provenance viewer;
- support for visual diffs as well as queries over workflows in different vistrails;
- a Control Flow Assistant to simplify the creation of workflows with loops and conditional constructs;
- support for global variables, so that modules deriving from Constant can be used to create variables that are shared among multiple workflows.
See the release notes for the complete list of changes.
- For a while, we have been accepting patches from our developer community. We are in the process of making patch submission easier and will provide detailed instructions shortly.
- Check out the new VisTrails vtDV3D package. vtDV3D was developed by Thomas Maxwell (NASA). It supports advanced (VTK-based) visualization and (CDAT-based) analysis of climate data. Documentation is available at http://portal.nccs.nasa.gov/DV3D.
- We now have a paper that describes the guts of VisTrails in The Architecture of Open Source Applications.
- A Web version of the Users Guide is available at http://www.vistrails.org/usersguide.
- The VisTrails methodology and infrastructure for creating provenance-rich, executable publications has been selected as a finalist of the Executable Paper Grand Challenge.
- The Opal plugin for VisTrails has been released. For more information see the NBCR Public Wiki: https://www.nbcr.net/pub/wiki/index.php?title=VisTrails
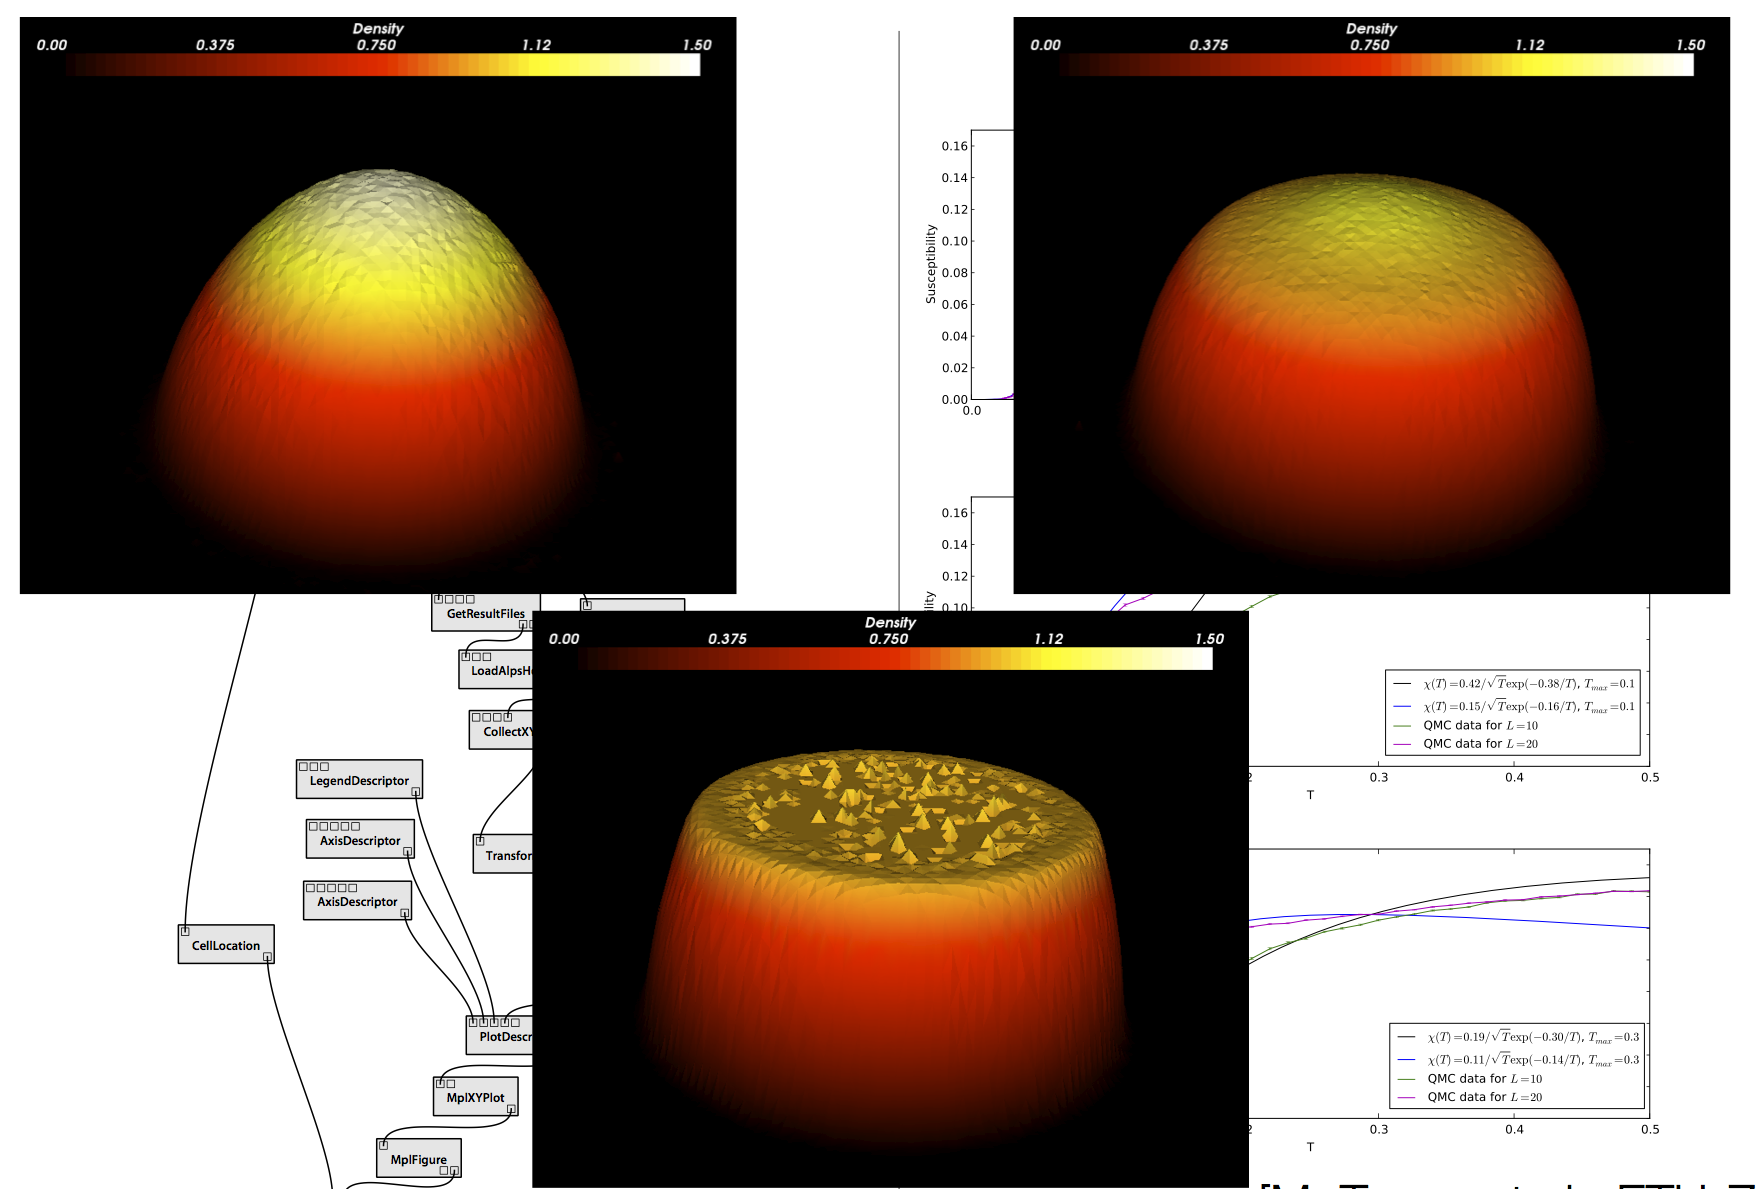
- ALPS 2.0 has been released and is now fully integrated with VisTrails. For details see the ALPS Web page.
- A description of the ALPS 2.0 system is now available at http://arxiv.org/abs/1101.2646. This is an example of an executable paper, whose results can be reproduced and verified. Check out this video which shows how we create and modify executable papers using VisTrails: http://www.vistrails.org/images/executable_paper_latex.mov
- LifeMapper clients for VisTrails have been released. See http://biodiversity.ku.edu/blog/lab-notes/lifemapper-vistrails-better-science for details.
- A paper describing the use of VisTrails to teach scientific visualization has received a best paper award at the Eurographics 2010 conference.
- David Koop gave a talk about VisTrails at PyCon 2010: For more details and a video of his lecture see http://us.pycon.org/2010/conference/schedule/event/13/
- ParaView 3.6.2 includes the VisTrails Provenance Explorer plugin. See the Kitware announcement and Kitware Source, Jan 2010.
- VisTrails was featured at Supercomputing 2009
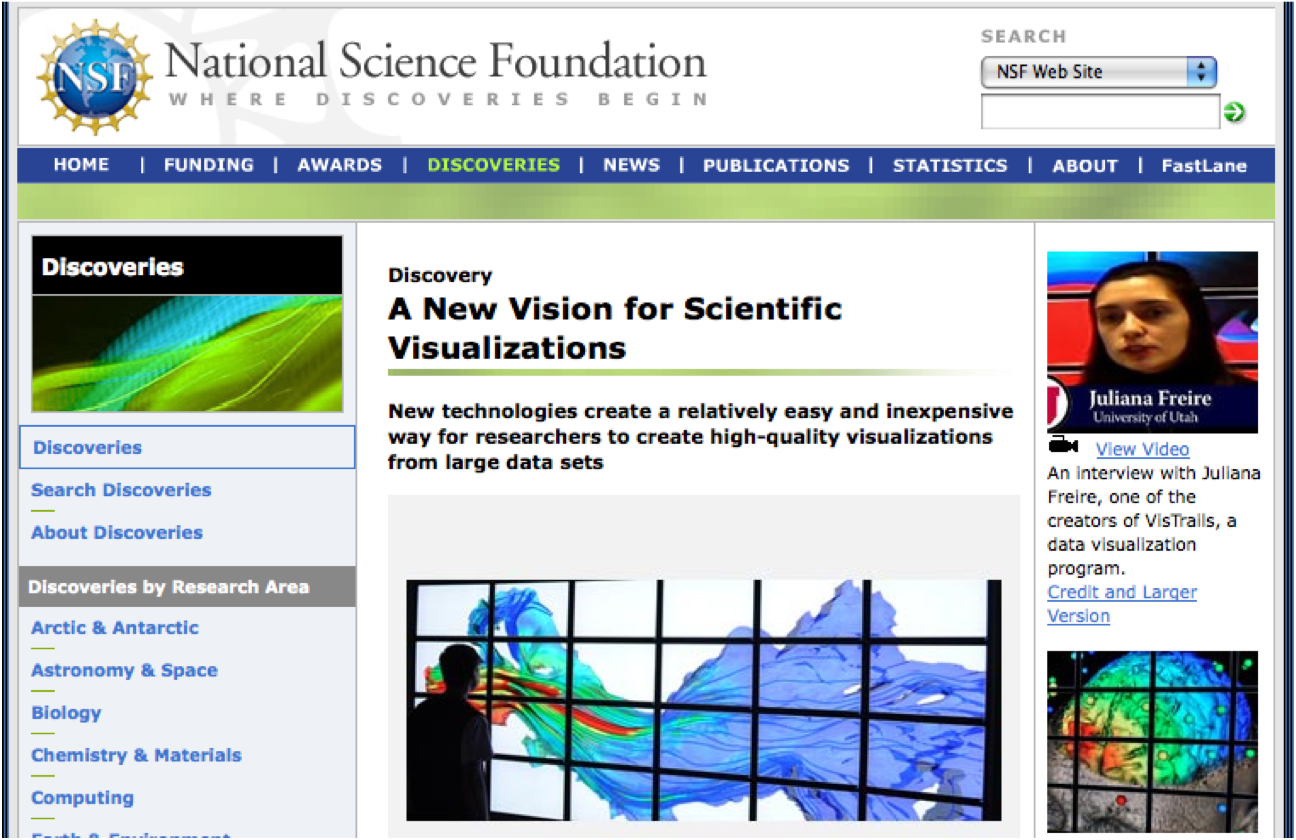
- VisTrails was featured as a National Science Foundation Discovery
VisTrails Overview
VisTrails is an open-source scientific workflow and provenance management system that provides support for simulations, data exploration and visualization. Whereas workflows have been traditionally used to automate repetitive tasks, for applications that are exploratory in nature, such as simulations, data analysis and visualization, very little is repeated---change is the norm. As an engineer or scientist generates and evaluates hypotheses about data under study, a series of different, albeit related, workflows are created while a workflow is adjusted in an interactive process. VisTrails was designed to manage these rapidly-evolving workflows.
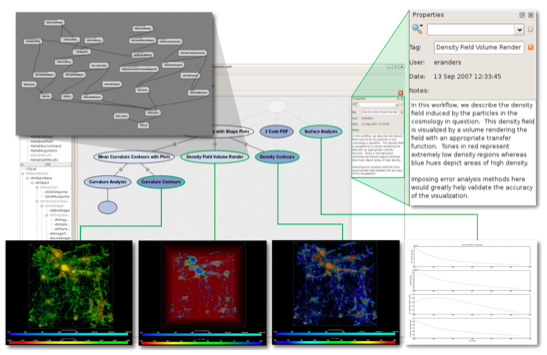
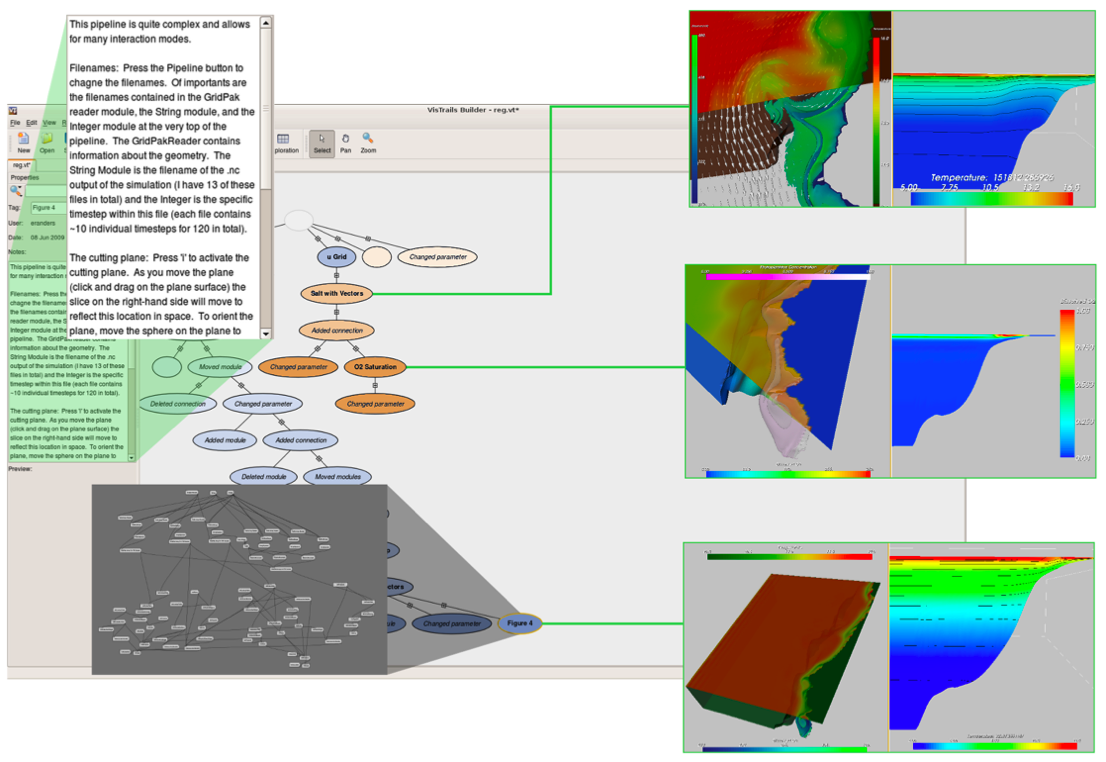
A key distinguishing feature of VisTrails is a comprehensive provenance infrastructure that maintains detailed history information about the steps followed and data derived in the course of an exploratory task: VisTrails maintains provenance of data products, of the workflows that derive these products and their executions. This information is persisted as XML files or in a relational database, and it allows users to navigate workflow versions in an intuitive way, to undo changes but not lose any results, to visually compare different workflows and their results, and to examine the actions that led to a result. It also enables a series operations and user interfaces that simplify workflow design and use, including the ability to create and refine workflows by analogy and to query workflows by example.
VisTrails supports the creation and execution of workflows. It allows the combination of loosely-coupled resources, specialized libraries, grid and Web services. The released version comes with support for several packages including, VTK, Image Magick, Web Services, and pylab. You can also download packages contributed by our users, as well as create your own packages/modules. Workflows can be run interactively, through the VisTrails GUI, or in batch using a VisTrails server.
VisTrails 1.0 was released in October 2007. Since then, the system has been downloaded thousands of times. VisTrails is written in Python and it uses the multi-platform Qt library for its user interface. It runs on Mac, Linux and Windows. You can download VisTrails from http://www.vistrails.org/index.php/Downloads
Publishing Reproducible Results
VisTrails 2.0 allows the inclusion of reproducible results in LaTeX/PDF documents. We provide a LaTeX package that allows users to add links to their results in the LaTeX source. For example:
\usepackage{vistrails}
...
\begin{figure}
\begin{center}
\subfigure[a=0.9]{\vistrail[filename=alps.vt, version=2, pdf]{width=8cm}}
\subfigure[a=0.9]{\vistrail[filename=alps.vt, version=11, pdf,buildalways]{width=8cm}}
\caption{A figure produced by an ALPS VisTrails workflow. Clicking the figure retrieves the workflow used to
create it. Opening that workflow on a machine with VisTrails and ALPS installed lets the reader execute the full calculation.}
\end{center}
\end{figure}
Once the LaTeX document is compiled, the figure in the PDF becomes active, and when clicked, it will invoke VisTrails and reproduce the result. You can also upload your results to CrowdLabs and export them to Web sites or Wikis, where users can interact with them through a Web browser. See e.g., http://www.crowdlabs.org/vistrails/medleys/details/26/
Building Workflows
VisTrails supports workflows expressed as dataflows. It can also support functional loops and conditional statements (new in VisTrails 1.3!). In addition, VisTrails is easily extensible; users can quickly create new modules or wrap existing code or libraries for use as modules in VisTrails. Also, the PythonSource module can be used to write one-time translations or test code in a workflow. See the Users' Guide for more details on all of these features.
Combining VisTrails Provenance with other Tools
The VisTrails provenance infrastructure can also be combined with interactive tools. We are developing a series of provenance plugins for different tools, including VisIt and ParaView. The open-source ParaView plugin has been released.
Visualizing and Comparing Workflow Results
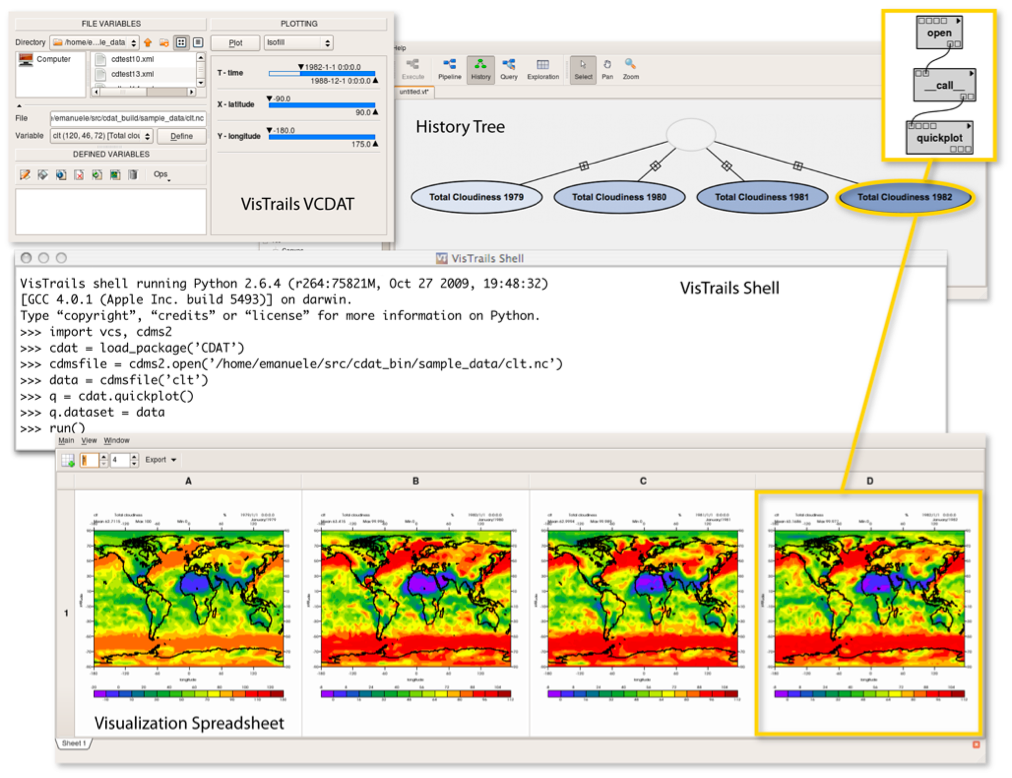
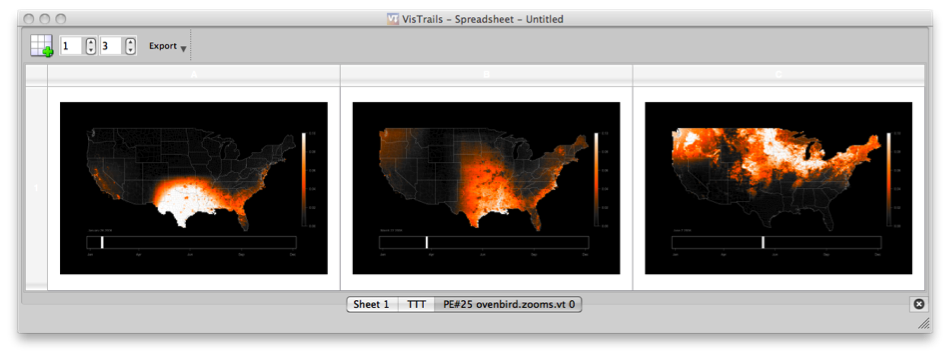
VisTrails provides a spreadsheet where users can compare the results of multiple workflows, or multiple workflow runs. Besides using a desktop, you can display the results of VisTrails workflows on a display wall or on an iPod. Users can also compare different workflows using the visual difference interface.
Querying and Refining Workflows by Example
Users can quickly construct expressive queries over a collection of workflows by example, using the same familiar interface they use to build workflows. VisTrails also provides an analogy mechanism whereby users can perform complex modifications to workflows by analogy, without having to directly modify the workflow specifications.
System Documentation
Screen Shots
User's Guide
A Web version of the Users Guide is currently under development and can be accessed at http://www.vistrails.org/usersguide.
FAQ
Mailing Lists
Publications, Tutorials and Presentations
People
Some Projects using VisTrails
| NASA Climate Data Analysis | DOE CDAT | ALPS Simulations | |
|---|---|---|---|
| NSF STC CMOP | NSF CDI Wildfire | NSF DataONE-EVA | |
|---|---|---|---|
Vistrails and Teaching
The VisTrails system has been used a tool to teach different courses, including Scientific Visualization and Digital Media. For more information on the educational uses of VisTrails see VisTrails and Teaching. Our paper describing a provenance-rich teaching methodology received the Best Paper Award at the Eurographics 2010 Education program.
Sponsors
This work has been partially supported by the National Science Foundation under grants IIS-0905385, IIS-0844572, IIS CAREER-0746500, CNS-0751152, IIS-0513692, CCF-0401498, CNS-0541560, OISE-0405402, OCE-0424602, CNS-0524096, IIS-0534628, the Department of Energy under the SciDAC program (SDM and VACET) and UV-CDAT, IBM Faculty Awards (2005, 2006, 2007, and 2008) and a University of Utah Seed Grant.
