Difference between revisions of "User:Tohline/ThreeDimensionalConfigurations/EFE Energies"
(→Adopted Evolutionary Constraints: Clean up presentation and discussion of Figures 1 and 2) |
|||
| Line 546: | Line 546: | ||
</div> | </div> | ||
Figure 3 of [http://adsabs.harvard.edu/abs/1995ApJ...446..472C Christodoulou et al. (1995)] presents a black-and-white contour plot of this <math>~E_L</math> function for the specific case of <math>~L = 4.71488</math>, which, for reference, is the total angular momentum of an equilibrium [[User:Tohline/Apps/MaclaurinSpheroids#Maclaurin_Spheroids_.28axisymmetric_structure.29|Maclaurin spheroid]] having an eccentricity, <math>~e = 0.85</math>. We have extracted this black-and-white contour plot from p. 477 of [http://adsabs.harvard.edu/abs/1995ApJ...446..472C Christodoulou et al. (1995)] and have reprinted it as the left panel of our Figure 1. Note that we have flipped the plot horizontally and rotated it by 90° so that the orientation of the axis pair, <math>~(\tfrac{b}{a},\tfrac{c}{a})</math>, conforms with the orientation of a related, information-rich diagram presented by [http://adsabs.harvard.edu/abs/1965ApJ...142..890C Chandrasekhar (1965)] — see also our [[User:Tohline/ThreeDimensionalConfigurations/JacobiEllipsoids#Sequence_Plots|accompanying discussion of equilibrium sequence plots]]. | Figure 3 of [http://adsabs.harvard.edu/abs/1995ApJ...446..472C Christodoulou et al. (1995)] presents a black-and-white contour plot of this <math>~E_L</math> function for the specific case of <math>~L = 4.71488</math>, which, for reference, is the total angular momentum of an equilibrium [[User:Tohline/Apps/MaclaurinSpheroids#Maclaurin_Spheroids_.28axisymmetric_structure.29|Maclaurin spheroid]] having an eccentricity, <math>~e = 0.85</math>. We have digitally extracted this black-and-white contour plot from p. 477 of the (PDF-formatted) [http://adsabs.harvard.edu/abs/1995ApJ...446..472C Christodoulou et al. (1995)] publication and have reprinted it as the left panel of our Figure 1. Note that we have flipped the plot horizontally and rotated it by 90° so that the orientation of the axis pair, <math>~(\tfrac{b}{a},\tfrac{c}{a})</math>, conforms with the orientation of a related, information-rich diagram presented by [http://adsabs.harvard.edu/abs/1965ApJ...142..890C Chandrasekhar (1965)] — see also our [[User:Tohline/ThreeDimensionalConfigurations/JacobiEllipsoids#Sequence_Plots|accompanying discussion of equilibrium sequence plots]]. | ||
<div align="center" id="Figure1"> | <div align="center" id="Figure1"> | ||
| Line 558: | Line 558: | ||
<table border="1" cellpadding="0" align="center"> | <table border="1" cellpadding="0" align="center"> | ||
<tr> | <tr> | ||
<td align="center" colspan=" | <td align="center" colspan="1"> | ||
[[File:JacobiPaperIFig3flipped.png| | [[File:JacobiPaperIFig3flipped.png|265px|Christodoulou1995Fig3 Flipped]] | ||
</td> | </td> | ||
<td align="center" colspan=" | <td align="center" colspan="1"> | ||
[[File:VisTrailsFig3d.png| | [[File:VisTrailsFig3e.png|265px|Both 2D contour plots overlayed]] | ||
</td> | |||
<td align="center" colspan="1"> | |||
[[File:VisTrailsFig3d.png|265px|Our 2D colored contour plot]] | |||
</td> | </td> | ||
</tr> | </tr> | ||
| Line 571: | Line 574: | ||
</div> | </div> | ||
In our Figure 2, | In our Figure 2, this same <math>~E_L</math> function has been displayed as a two-dimensional free-energy surface draped across the three-dimensional <math>~(\tfrac{b}{a},\tfrac{c}{a},E)</math> domain, where color as well as depth has been used to tag energy values. The two-dimensional, colored contour plot presented in the right-hand panel of our Figure 1 results from the projection of this free-energy surface onto the <math>~(\tfrac{b}{a},\tfrac{c}{a})</math> plane; it reproduces in quantitative detail the black-and-white contour plot that we have extracted from [http://adsabs.harvard.edu/abs/1995ApJ...446..472C Christodoulou et al. (1995)]. In an effort to (qualitatively) illustrate this agreement, we have digitally "pasted" the black-and-white contour plot from [http://adsabs.harvard.edu/abs/1995ApJ...446..472C Christodoulou et al. (1995)] onto our colored contour plot and presented the combined image in the middle panel of our Figure 1. | ||
| Line 596: | Line 599: | ||
</div> | </div> | ||
<!-- "OVERLAID" IMAGES SHOWING RELATIONSHIP BETWEEN B/W CONTOUR PLOT AND (1) OUR JACOBI SEQUENCE PLOT; (2) THE RIEMANN SEQUENCE DIAGRAM FROM EFE; AND (3) OUR COLORED-CONTOUR PLOT | |||
<div align="center" id="Figure3"> | <div align="center" id="Figure3"> | ||
| Line 612: | Line 615: | ||
</td> | </td> | ||
<td align="center" colspan="2"> | <td align="center" colspan="2"> | ||
[[File:OverlapAttempt1.png|250px|Chandrasekhar Figure2]] | [[File:OverlapAttempt1.png|250px|Chandrasekhar Figure2]] | ||
</td> | </td> | ||
| Line 624: | Line 626: | ||
</table> | </table> | ||
</div> | </div> | ||
--> | |||
=See Also= | =See Also= | ||
Revision as of 22:42, 1 July 2016

|
|---|
| | Tiled Menu | Tables of Content | Banner Video | Tohline Home Page | |
Properties of Homogeneous Ellipsoids (2)
In addition to pulling from §53 of Chandrasekhar's EFE, here, we lean heavily on the papers by M. D. Weinberg & S. Tremaine (1983, ApJ, 271, 586) (hereafter, WT83) and by D. M. Christodoulou, D. Kazanas, I. Shlosman, & J. E. Tohline (1995, ApJ, 446, 472) (hereafter, Paper I).
Sequence-Defining Dimensionless Parameters
A Riemann sequence of S-type ellipsoids is defined by the value of the dimensionless parameter,
|
<math>~f</math> |
<math>~\equiv</math> |
<math>~\frac{\zeta}{\Omega} = </math> constant, |
[ EFE, §48, Eq. (31) ]
[ WT83, Eq. (5) ]
[ Paper I, Eq. (2.1) ]
where, <math>~\zeta</math> is the system's vorticity as measured in a frame rotating with angular velocity, <math>~\Omega</math>. Alternatively, we can use the dimensionless parameter,
|
<math>~x</math> |
<math>~\equiv</math> |
<math>~\biggl[\frac{ab}{a^2 + b^2} \biggr]f \, ,</math> |
or,
|
<math>~\Lambda</math> |
<math>~\equiv</math> |
<math>~-\biggl[\frac{ab}{a^2 + b^2} \biggr] \Omega f = -\Omega x \, .</math> |
[ WT83, Eq. (4) ]
Conserved Quantities
Algebraic expressions for the conserved energy, <math>~E</math>, angular momentum, <math>~L</math>, and circulation, <math>~C</math>, are, respectively,
|
<math>~E</math> |
<math>~=</math> |
<math>~\frac{1}{2}v^2 + \frac{1}{2}(a^2 + b^2)(\Lambda^2 + \Omega^2) - 2ab\Lambda\Omega - 2I </math> |
|
|
<math>~\rightarrow</math> |
<math>~\cancelto{0}{\frac{1}{2}v^2} + \frac{1}{2} [(a+bx)^2 + (b+ax)^2]\Omega^2 - 2I \, ,</math> |
[ 1st expression — EFE, §53, Eq. (239) ]
[ 2nd expression — Paper I, Eq. (2.7) ]
where — see an accompanying discussion for the definitions of <math>~A_1</math>, <math>~A_2</math>, and <math>~A_3</math>,
|
<math>~I</math> |
<math>~=</math> |
<math>~A_1a^2 + A_2b^2 + A_3c^2 \, ;</math> |
[ 1st expression — EFE, §53, Eq. (239) ]
[ 2nd expression — Paper I, Eq. (2.8) ]
|
<math>~\frac{5L}{M}</math> |
<math>~=</math> |
<math>~(a^2 + b^2)\Omega - 2ab\Lambda</math> |
|
|
<math>~=</math> |
<math>~ (a^2 + b^2 + 2abx)\Omega \, ;</math> |
[ 1st expression — EFE, §53, Eq. (240) ]
[ 2nd expression — Paper I, Eq. (2.5) ]
|
<math>~\frac{5C}{M}</math> |
<math>~=</math> |
<math>~(a^2 + b^2)\Lambda - 2ab\Omega</math> |
|
|
<math>~=</math> |
<math>~- [2ab + (a^2 + b^2)x ]\Omega \, .</math> |
[ 1st expression — EFE, §53, Eq. (241) ]
[ 2nd expression — Paper I, Eq. (2.6) ]
If we rewrite the expression for the system's free energy in terms of <math>~L</math> (and x) instead of <math>~\Omega</math> (and x), we have,
|
<math>~E</math> |
<math>~=</math> |
<math>~\frac{1}{2} \biggl(\frac{5L}{M}\biggr)^2 \frac{(a+bx)^2 + (b+ax)^2}{(a^2 + b^2 + 2abx)^2} - 2I \, ,</math> |
[ Paper I, Eq. (3.4) ]
Note that, based on the units chosen in Paper I, <math>~M = 5</math>, and <math>~abc = 15/4</math>.
Aside: Chandra's Notation
According to equation (107) in §21 of EFE, it appears as though,
|
<math>~A_i - A_j</math> |
<math>~=</math> |
<math>~- (a_i^2 - a_j^2)A_{ij} \, .</math> |
And, according to equation (105) in §21 of EFE, it appears as though,
|
<math>~B_{ij}</math> |
<math>~=</math> |
<math>~A_j - a_i^2A_{ij} \, .</math> |
So, for example,
|
<math>~A_{12} </math> |
<math>~=</math> |
<math>~-\biggl[ \frac{A_1 - A_2}{a_1^2 - a_2^2} \biggr] \, ,</math> |
and,
|
<math>~B_{12} </math> |
<math>~=</math> |
<math>~A_2 + a_1^2\biggl[ \frac{A_1 - A_2}{a_1^2 - a_2^2} \biggr] </math> |
|
|
<math>~=</math> |
<math>~\frac{(a_1^2 - a_2^2)A_2 + a_1^2(A_1 - A_2)}{a_1^2 - a_2^2} </math> |
|
|
<math>~=</math> |
<math>~\frac{a_1^2A_1 - a_2^2A_2 }{a_1^2 - a_2^2} \, .</math> |
Free Energy Surface(s)
Scope
Consider a self-gravitating ellipsoid having the following properties:
- Semi-axis lengths, <math>~(x,y,z)_\mathrm{surface} = (a,b,c)</math>, and corresponding volume, <math>~4\pi/(3abc)</math> ; and consider only the situations <math>0 \le b/a \le 1</math> and <math>0 \le c/a \le 1</math> ;
- Total mass, <math>~M</math> ;
- Uniform density, <math>~\rho = (3 M)/(4\pi abc) </math> ;
- Figure is spinning about its c axis with angular velocity, <math>~\Omega</math> ;
- Internal, steady-state flow exhibiting the following characteristics:
- No vertical (z) motion;
- Elliptical (x-y plane) streamlines everywhere having an ellipticity that matches that of the overall figure, that is, <math>~e = (1-b^2/a^2)^{1/2}</math> ;
- The velocity components, <math>~v_x</math> and <math>~v_y</math>, are linear in the coordinate and, overall, characterized by the magnitude of the vorticity, <math>~\zeta</math> .
Such a configuration is uniquely specified by the choice of six key parameters: <math>~a</math>, <math>~b</math>, <math>~c</math>, <math>~M</math>, <math>~\Omega</math>, and <math>~\zeta</math> .
Free Energy of Incompressible, Constant Mass Systems
We are interested, here, in examining how the free energy of such a system will vary as it is allowed to "evolve" as an incompressible fluid — i.e., holding <math>~\rho</math> fixed — through different ellipsoidal shapes while conserving its total mass. Following Paper I, we choose to set <math>~M = 5</math> — which removes mass from the list of unspecified key parameters — and we choose to set <math>~\rho = \pi^{-1}</math>, which is then reflected in a specification of the semi-axis, <math>~a</math>, in terms of the pair of dimensionless axis ratios, <math>~b/a</math> and <math>~c/a</math>, namely,
|
<math>~a^3</math> |
<math>~=</math> |
<math>~\frac{3Ma^2}{4\pi(bc)\rho} = \frac{15}{4}\biggl(\frac{b}{a}\biggr)^{-1} \biggl(\frac{c}{a}\biggr)^{-1}\, .</math> |
Moving forward, then, a unique ellipsoidal configuration is identified via the specification of four, rather than six, key parameters — <math>~b/a</math>, <math>~c/a</math>, <math>~\Omega</math>, and <math>~x</math> — and the free energy of that configuration is given by the expression,
|
<math>~E\biggl(\frac{b}{a}, \frac{c}{a}, \Omega, x\biggr)</math> |
<math>~=</math> |
<math>~\frac{a^2}{2} \biggl[\biggl(1+\frac{b}{a} \cdot x\biggr)^2 + \biggl(\frac{b}{a}+x\biggr)^2\biggr]\Omega^2 - 2I </math> |
|
|
<math>~=</math> |
<math>~\biggl[ \frac{15}{4}\biggl(\frac{b}{a}\biggr)^{-1} \biggl(\frac{c}{a}\biggr)^{-1} \biggr]^{2/3} \biggl\{\frac{1}{2} \biggl[\biggl(1+\frac{b}{a} \cdot x\biggr)^2 + \biggl(\frac{b}{a}+x\biggr)^2\biggr]\Omega^2 - \frac{2I}{a^2}\biggr\} \, ,</math> |
where,
|
<math>~x</math> |
<math>~\equiv</math> |
<math>~\biggl[\frac{(b/a)}{1 + (b/a)^2} \biggr]\frac{\zeta}{\Omega} \, ,</math> |
|
<math>~\frac{I}{a^2}</math> |
<math>~=</math> |
<math>~\biggl[A_1 + A_2\biggl(\frac{b}{a}\biggr)^2 + A_3\biggl(\frac{c}{a}\biggr)^2 \biggr] \, ,</math> |
and the functional behavior of the coefficients, <math>~A_1</math>, <math>~A_2</math>, and <math>~A_3</math>, are given by the expressions provided in an accompanying discussion.
Alternatively, replacing <math>~\Omega</math> in favor of <math>~L</math>, we have,
|
<math>~E\biggl(\frac{b}{a}, \frac{c}{a}, L, x\biggr)</math> |
<math>~=</math> |
<math>~\frac{L^2}{2a^2} \biggl[ \biggl(1+\frac{b}{a}\cdot x \biggr)^2 + \biggl(\frac{b}{a}+x \biggr)^2 \biggr] \biggl[ 1 + \biggl(\frac{b}{a}\biggr)^2 + 2\biggl(\frac{b}{a}\biggr)x \biggr]^{-2} - 2I </math> |
|
|
<math>~=</math> |
<math>~\frac{L^2}{2} \biggl[ \frac{15}{4}\biggl(\frac{b}{a}\biggr)^{-1} \biggl(\frac{c}{a}\biggr)^{-1} \biggr]^{-2/3} \biggl[ \biggl(1+\frac{b}{a}\cdot x \biggr)^2 + \biggl(\frac{b}{a}+x \biggr)^2 \biggr] \biggl[ 1 + \biggl(\frac{b}{a}\biggr)^2 + 2\biggl(\frac{b}{a}\biggr)x \biggr]^{-2} </math> |
|
|
|
<math>~- 2\biggl[ \frac{15}{4}\biggl(\frac{b}{a}\biggr)^{-1} \biggl(\frac{c}{a}\biggr)^{-1} \biggr]^{2/3} \biggl[A_1 + A_2\biggl(\frac{b}{a}\biggr)^2 + A_3\biggl(\frac{c}{a}\biggr)^2 \biggr]\, .</math> |
Adopted Evolutionary Constraints
Conserve Only L
Let's fix the total angular momentum, <math>~L</math>, of a triaxial configuration and examine how the configuration's free energy varies as we allow it to contort through different triaxial shapes — that is, as its pair of axis ratios varies, always maintaining <math>~\tfrac{b}{a} < 1</math> — and as we vary <math>~x</math>, which characterizes the fraction of angular momentum that is stored in internal spin versus overall figure rotation. The desired free-energy function, <math>~E(\tfrac{b}{a},\tfrac{c}{a}, x)|_L</math>, has just been defined, but visualizing its behavior is difficult because, in this situation, the free energy is a three-dimensional surface draped across the four-dimensional domain, <math>~(\tfrac{b}{a},\tfrac{c}{a}, x, E_L)</math>.
Acknowledging that we are primarily interested in identifying extrema of this free-energy function, the discussion presented in §3.2 of Christodoulou et al. (1995) shows us how to reduce the dimensionality of this problem by one. There, it is shown that, as long as <math>~\tfrac{b}{a} \ne 1</math>, extrema exist in the <math>~x</math>-coordinate direction — that is, <math>~\partial E_L/\partial x = 0</math> — only if <math>~x = 0.</math> For a given choice of <math>~L</math>, therefore, the relevant two-dimensional free-energy surface is defined by the expression,
|
<math>~E\biggl(\frac{b}{a}, \frac{c}{a}, x=0\biggr)\biggr|_L</math> |
<math>~=</math> |
<math>~\frac{L^2}{2} \biggl[ \frac{15}{4}\biggl(\frac{b}{a}\biggr)^{-1} \biggl(\frac{c}{a}\biggr)^{-1} \biggr]^{-2/3} \biggl[ 1 + \biggl(\frac{b}{a}\biggr)^2\biggr]^{-1} </math> |
|
|
|
<math>~ - 2\biggl[ \frac{15}{4}\biggl(\frac{b}{a}\biggr)^{-1} \biggl(\frac{c}{a}\biggr)^{-1} \biggr]^{2/3} \biggl[A_1 + A_2\biggl(\frac{b}{a}\biggr)^2 + A_3\biggl(\frac{c}{a}\biggr)^2 \biggr]\, .</math> |
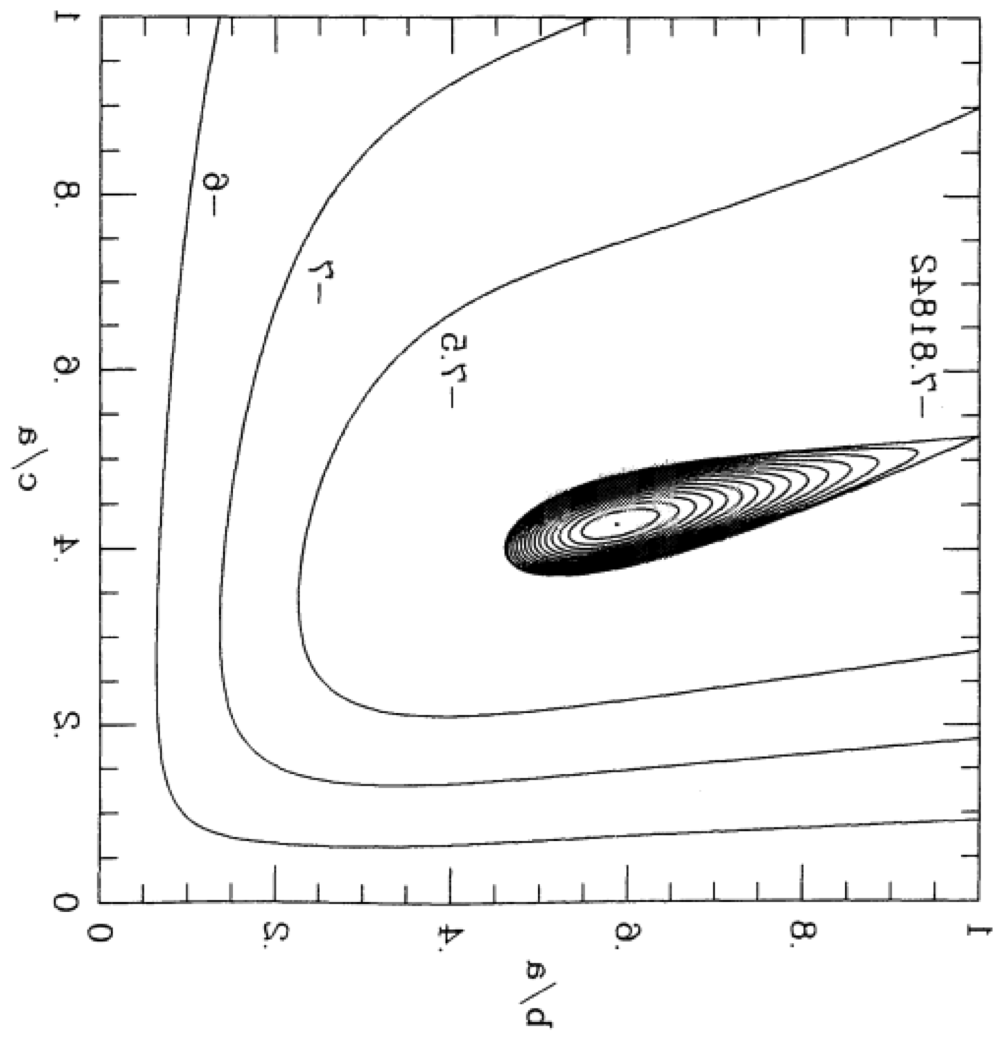
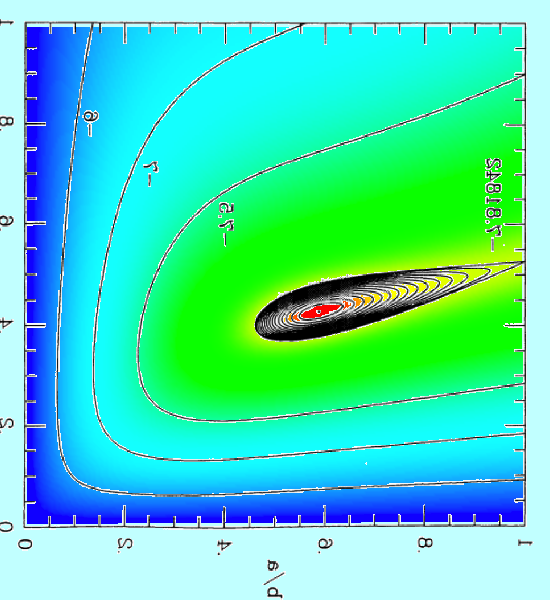
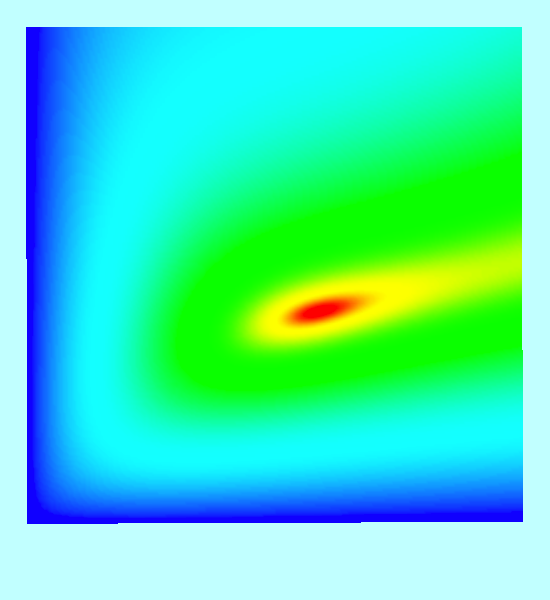
Figure 3 of Christodoulou et al. (1995) presents a black-and-white contour plot of this <math>~E_L</math> function for the specific case of <math>~L = 4.71488</math>, which, for reference, is the total angular momentum of an equilibrium Maclaurin spheroid having an eccentricity, <math>~e = 0.85</math>. We have digitally extracted this black-and-white contour plot from p. 477 of the (PDF-formatted) Christodoulou et al. (1995) publication and have reprinted it as the left panel of our Figure 1. Note that we have flipped the plot horizontally and rotated it by 90° so that the orientation of the axis pair, <math>~(\tfrac{b}{a},\tfrac{c}{a})</math>, conforms with the orientation of a related, information-rich diagram presented by Chandrasekhar (1965) — see also our accompanying discussion of equilibrium sequence plots.
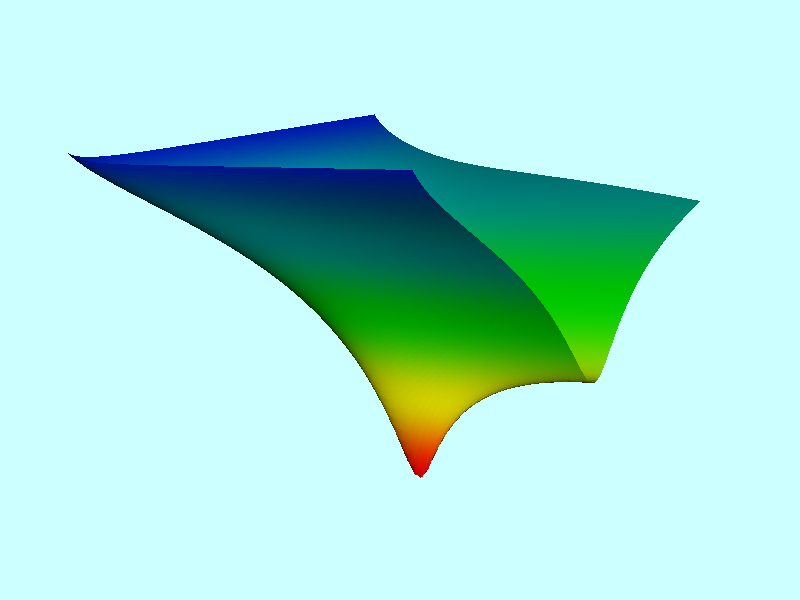
In our Figure 2, this same <math>~E_L</math> function has been displayed as a two-dimensional free-energy surface draped across the three-dimensional <math>~(\tfrac{b}{a},\tfrac{c}{a},E)</math> domain, where color as well as depth has been used to tag energy values. The two-dimensional, colored contour plot presented in the right-hand panel of our Figure 1 results from the projection of this free-energy surface onto the <math>~(\tfrac{b}{a},\tfrac{c}{a})</math> plane; it reproduces in quantitative detail the black-and-white contour plot that we have extracted from Christodoulou et al. (1995). In an effort to (qualitatively) illustrate this agreement, we have digitally "pasted" the black-and-white contour plot from Christodoulou et al. (1995) onto our colored contour plot and presented the combined image in the middle panel of our Figure 1.
Our Figure 2 image of the free-energy surface helps illuminate the description of this surface that appears in the caption of Fig. 3 from Christodoulou et al. (1995). Quoting from that figure caption: "The [equilibrium] Maclaurin spheroid sits on a saddle point <math>~[(\tfrac{b}{a},\tfrac{c}{a}) = (1.0,0.52678); E_0 = -7.81842]</math>, while a global minimum with <math>~E_0 = -7.83300</math> exists at <math>~(\tfrac{b}{a},\tfrac{c}{a}) = (0.588,0.428)</math>."
See Also

|
|---|
|
© 2014 - 2021 by Joel E. Tohline |


