Difference between revisions of "Main Page"
| Line 56: | Line 56: | ||
=== [[Users_Guide|User's Guide]] === | === [[Users_Guide|User's Guide]] === | ||
On the link above is | On the link above is an (always evolving) User's Guide. | ||
=== [[Video_Tutorial|Video Tutorial]] === | === [[Video_Tutorial|Video Tutorial]] === | ||
Revision as of 22:15, 1 February 2007
Hello, and welcome to the VisTrails Wiki.
What is it?
Recently, workflows have been emerging as a paradigm for representing and managing complex computations. Workflows can capture complex analyses processes at various levels of detail and provide the provenance information necessary for reproducibility, result publication and result sharing among collaborators. Because of the formalism they provide and the automation they support, workflows have the potential to accelerate and transform the information analysis process. Workflows are rapidly replacing primitive shell scripts as evidenced by the release of Apple’s Mac OS X Automator, Microsoft Windows Workflow Foundation, and the SGI Scientific Workflow Solution.
VisTrails is a new scientific workflow management system developed at the University of Utah that provides support for data exploration and visualization. Whereas workflows have been traditionally used to automate repetitive tasks, for applications that are exploratory in nature, very little is repeated---change is the norm. As an engineer or scientist generates and evaluates hypotheses about data under study, a series of different, albeit related, workflows are created while a workflow is adjusted in an interactive process. VisTrails was designed to manage these rapidly-evolving workflows. VisTrails streamlines the creation, execution and sharing of complex visualizations, data mining or other large-scale data analysis applications. By automatically managing the data, metadata, and the data exploration process, VisTrails allows users to focus on the task at hand and relieves them from tedious and time-consuming tasks involved in organizing the vast volumes of data they manipulate. VisTrails provides infrastructure that can be combined with and enhance existing visualization and workflow systems.
Although VisTrails was originally built to address the needs of exploratory scientific applications, the infrastructure it provides is very general. This became clear as the system was demoed to people from different domains, both from industry and academia. VisTrails has the potential to reduce the time to insight in virtually any exploratory task.
Downloading
Get the open source version of VisTrails here.
Publications and Presentations
Managing Rapidly-Evolving Scientific Workflows (by Juliana Freire, Claudio T. Silva, Steven P. Callahan, Emanuele Santos, Carlos E. Scheidegger and Huy T. Vo) Invited paper, in the proceedings of the International Provenance and Annotation Workshop (IPAW), 2006. presentation
Visualization in Radiation Oncology: Towards Replacing the Laboratory Notebook (by Erik W. Anderson, Steven P. Callahan, George T. Y. Chen, Juliana Freire, Emanuele Santos, Carlos E. Scheidegger, Claudio T. Silva and Huy T. Vo) SCI Institute Technical Report, No. UUSCI-2006-17, University of Utah, 2006.
Using Provenance to Streamline Data Exploration through Visualization (by Steven P. Callahan, Juliana Freire, Emanuele Santos, Carlos E. Scheidegger, Claudio T. Silva and Huy T. Vo) SCI Institute Technical Report, No. UUSCI-2006-016, University of Utah, 2006.
Managing the Evolution of Dataflows with VisTrails (by Steven P. Callahan, Juliana Freire, Emanuele Santos, Carlos E. Scheidegger, Claudio T. Silva and Huy T. Vo) IEEE Workshop on Workflow and Data Flow for Scientific Applications (SciFlow) 2006. presentation
VisTrails: Visualization meets Data Management (by Steven P. Callahan, Juliana Freire, Emanuele Santos, Carlos E. Scheidegger, Claudio T. Silva and Huy T. Vo) In Proceedings of ACM SIGMOD 2006. presentation
VisTrails: A Short Tutorial (by Steven P. Callahan, Juliana Freire, Emanuele Santos, Carlos E. Scheidegger, Claudio T. Silva and Huy T. Vo) Technical Report. University of Utah, 2005.
VisTrails: Enabling Interactive Multiple-View Visualizations (by Louis Bavoil, Steven P. Callahan, Patricia J. Crossno, Juliana Freire, Carlos E. Scheidegger, Claudio T. Silva and Huy T. Vo) In Proceedings of IEEE Visualization, 2005. presentation
A poster on VisTrails applications
Documentation
User's Guide
On the link above is an (always evolving) User's Guide.
Video Tutorial
We are in the process of creating a video tutorial that can be used to guide users through the process of learning to use VisTrails. The videos that follow below are a preliminary version of this tutorial, and will keep evolving towards a complete tutorial.
 Adding a Parameter via Modules
 Querying the Version Tree and Pipelines
Videos
Please note that some of these videos were generated using versions of VisTrails, and the interface might look different than the one available in the most up-to-date version.

|
Demonstration
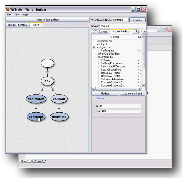
This video shows basic usage of VisTrails by going through three examples. Some of the features shown are:
As this is an old version of the system, some of the features are not currently available. |

|
Radiation Oncology
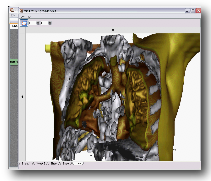
This video shows how some of VisTrails features were used on a Radiation Oncology study. As this is an old version of the system, some of the features are not currently available. |
People
Principal Investigators
- Dr. Juliana Freire
- Dr. Claudio Silva
Current Team
- Erik Anderson
- Steven P. Callahan
- David Koop
- Emanuele Santos
- Carlos E. Scheidegger
- Nathan Smith
- Huy T. Vo
Previous Members
- Louis Bavoil
- Marcelo Nery dos Santos
- Wayne Tyler
Sponsors
This work has been partially supported by the National Science Foundation under grants IIS-0513692, CCF-0401498, CNS-0541560, OISE-0405402, OCE-0424602, the Department of Energy under the SciDAC program (SDM and VACET), IBM Faculty Awards (2005 and 2006) and a University of Utah Seed Grant.