Difference between revisions of "Projects using VisTrails"
Jump to navigation
Jump to search
| (17 intermediate revisions by 3 users not shown) | |||
| Line 1: | Line 1: | ||
== News == | |||
* Check out the new Software for Assisted Habitat Modeling (SAHM) package for VisTrails at http://www.mesc.usgs.gov/products/software/sahm/. SAHM was developed by [http://www.mesc.usgs.gov/Staff/staffprofile.asp?StaffID=1001 Jeff Morrisette's] group at the USGS. [http://www.fort.usgs.gov/Staff/staffprofile.asp?StaffID=518 Colin Talbert] is responsible for much of the code including the VisTrails wrapping. The package expedites habitat modeling and help maintain a record of the various input data, pre- and post- processing steps, and modeling options incorporated in the construction of a species distribution model. | |||
** A tutorial about the SAHM Package for VisTrails is now available. Check out the new tutorial for the [http://www.fort.usgs.gov/products/publications/pub_abstract.asp?PubID=23400 Software for Assisted Habitat Modeling (SAHM) package in VisTrails], by N. Young. | |||
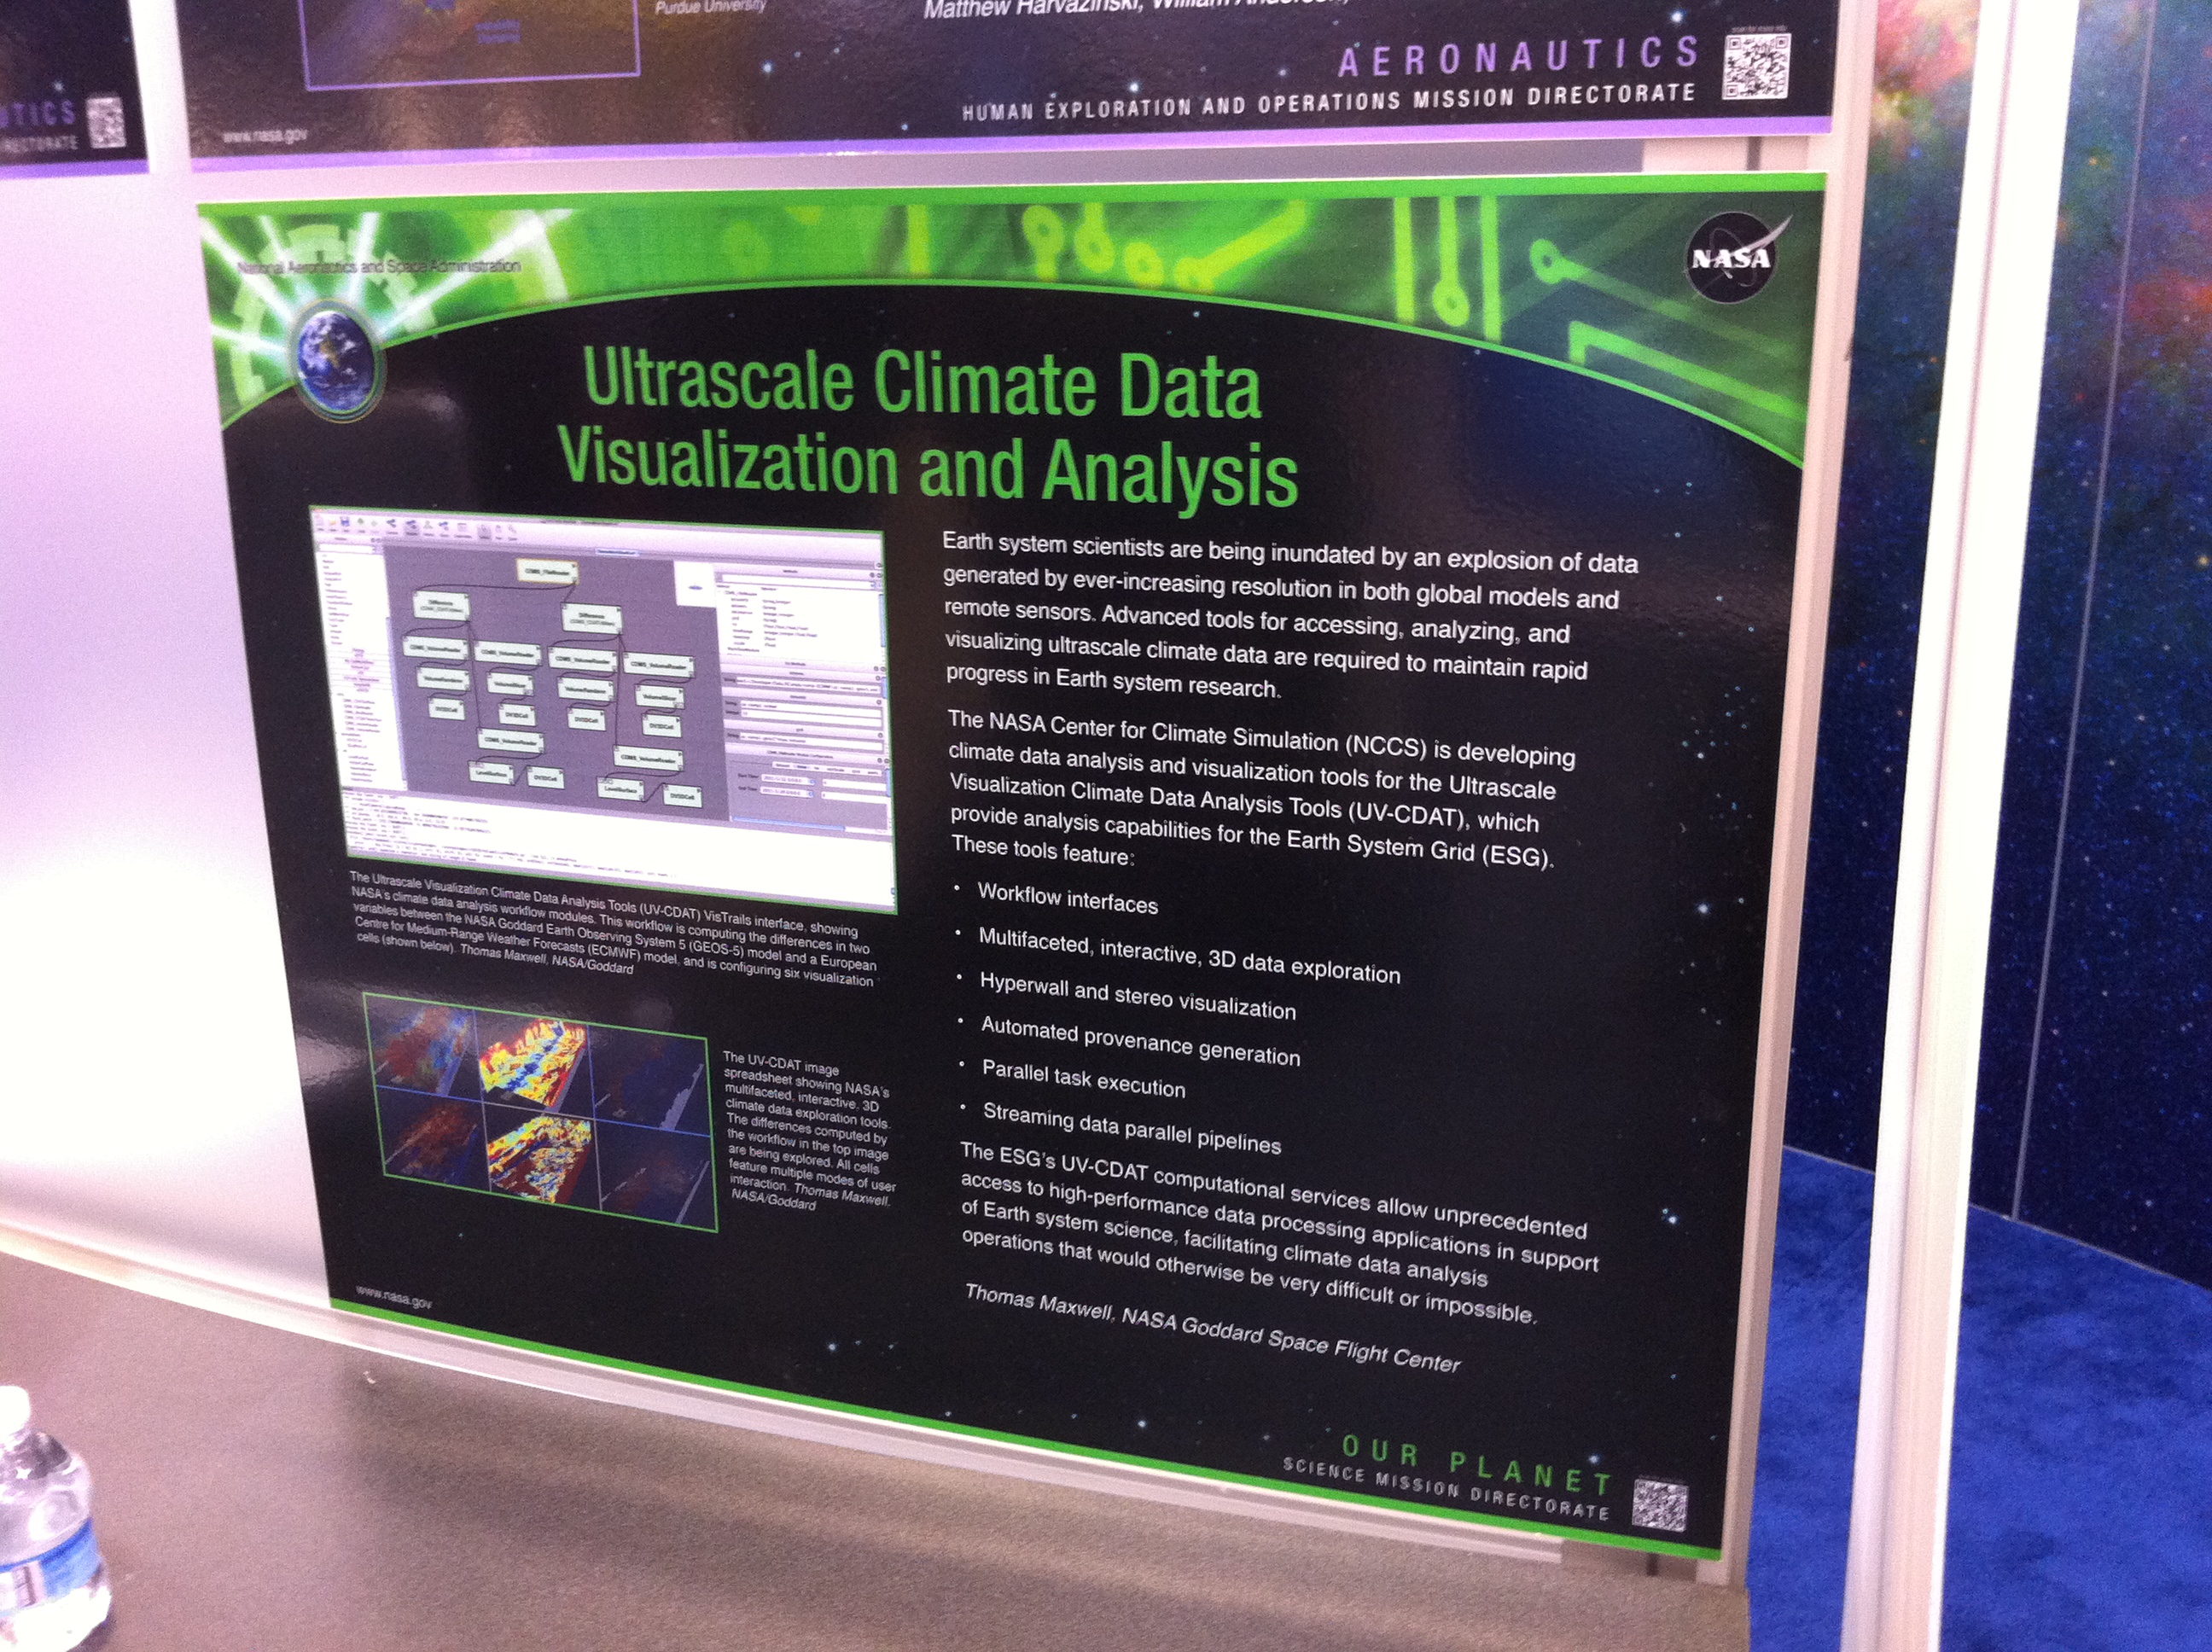
* Thomas Maxwell (NASA) has demoed his UV-CDAT package, vtDV3D at SC11. UV-CDAT is a new system for climate data analysis that combines VisTrails, CDAT and ParaView. | |||
** vtDV3D supports advanced (VTK-based) visualization and (CDAT-based) analysis of climate data. | |||
** Documentation is available at [http://portal.nccs.nasa.gov/DV3D http://portal.nccs.nasa.gov/DV3D]. | |||
{| align="center" | |||
|- | |||
| [[Image:vtDV3D-sc11.jpg|140px]] | |||
| [[Image:vtDV3D.png|400px]] | |||
|- | |||
|} | |||
* The Opal plugin for VisTrails has been released. For more information see the NBCR Public Wiki: https://www.nbcr.net/pub/wiki/index.php?title=VisTrails | |||
* ALPS 2.0 has been released and is now fully integrated with VisTrails. For details see [http://alps.comp-phys.org the ALPS Web page]. | |||
* A description of the ALPS 2.0 system is now available at http://arxiv.org/abs/1101.2646. This is an example of an executable paper, whose results can be reproduced and verified. Check out this video which shows how we create and modify executable papers using VisTrails: http://www.vistrails.org/images/executable_paper_latex.mov | |||
* LifeMapper clients for VisTrails have been released. See http://biodiversity.ku.edu/blog/lab-notes/lifemapper-vistrails-better-science for details. | |||
== Incomplete List of Projects that use VisTrails == | == Incomplete List of Projects that use VisTrails == | ||
* | * NASA Earth Exchange (NEX) | ||
** https://c3.nasa.gov/nex/static/media/publication/TOPS-ESTF-11-0015.pdf | |||
** https://c3.nasa.gov/nex/resources/35/ | |||
* [[ExecutablePapers|Supporting the creation, review and re-use of executable papers]] | |||
* vtDV3D is a Vistrails package of high-level modules for UV-CDAT developed by Thomas P. Maxwell (NASA). It provides user-friendly workflow interfaces for advanced visualization and analysis of climate data at a level appropriate for scientists. This project is motivated by the observation that climate scientists can greatly benefit from advanced visualization methods, but they rarely use these tools because the existing interfaces are too complex. vtDV3D‘s simple GUI interface is designed to be readily used by busy scientists who have little time to invest in learning complex new frameworks. The application builds on VTK, an open-source, object-oriented library, for visualization and analysis. | |||
** http://portal.nccs.nasa.gov/DV3D | |||
* Lifemapper | |||
** http://lifemapper.org/clients.shtml | |||
http://www.stccmop.org/knowledge_transfer/software | * CMOP: "The Center for Coastal Margin Observation & Prediction (CMOP) seeks to develop and disseminate a new paradigm for conducting coastal-margin science, one that shifts from reactive to anticipatory science–i.e., from “observing and remediating” to “predicting and steering”–by taking advantage of the inherent power of structured integrations of information, methods and people: “collaborators". CMOP develops advanced 3D numerical simulation models for coastal margins as well as tools for calibrating the models and analyzing their results. | ||
** http://www.stccmop.org/knowledge_transfer/software | |||
* DataOne: "The Data Observation Network for Earth (DataONE) is poised to be the foundation of new innovative environmental science through a distributed framework and sustainable cyberinfrastructure that meets the needs of science and society for open, persistent, robust, and secure access to well-described and easily discovered Earth observational data." | * DataOne: "The Data Observation Network for Earth (DataONE) is poised to be the foundation of new innovative environmental science through a distributed framework and sustainable cyberinfrastructure that meets the needs of science and society for open, persistent, robust, and secure access to well-described and easily discovered Earth observational data." | ||
** https://dataone.org | |||
https://dataone.org | |||
* ALPS: "The ALPS project (Algorithms and Libraries for Physics Simulations) is an open source effort aiming at providing high-end simulation codes for strongly correlated quantum mechanical systems as well as C++ libraries for simplifying the development of such code. ALPS strives to increase software reuse in the physics community." | * ALPS: "The ALPS project (Algorithms and Libraries for Physics Simulations) is an open source effort aiming at providing high-end simulation codes for strongly correlated quantum mechanical systems as well as C++ libraries for simplifying the development of such code. ALPS strives to increase software reuse in the physics community." | ||
** https://alps.comp-phys.org/mediawiki/index.php/Test_page | |||
* Analyzing the results of astrophysics CFD simulations | |||
** http://www.phys.lsu.edu/~tohline/vistrails/ | |||
* VACET: "The Visualization and Analytics Center for Enabling Technologies (VACET) focuses on leveraging scientific visualization and analytics software technology as an enabling technology for increasing scientific productivity and insight. Advances in computational technology have resulted in an "information big bang," which in turn has created a significant data understanding challenge. This challenge is widely acknowledged to be one of the primary bottlenecks in contemporary science. Using an organizational model such as VACET, we are well positioned to respond to the needs of a diverse set of scientific stakeholders in a coordinated fashion using a range of visualization, mathematics, statistics, computer and computational science and data management technologies." | |||
** http://www.vacet.org/ | |||
* | * ParaView: "ParaView is an open-source, multi-platform data analysis and visualization application. ParaView users can quickly build visualizations to analyze their data using qualitative and quantitative techniques. The data exploration can be done interactively in 3D or programmatically using ParaView's batch processing capabilities." | ||
** http://www.paraview.org/ | |||
* CDAT: "Climate Data Analysis Tools (CDAT) is a software infrastructure that uses an object-oriented scripting language to link together separate software subsystems and packages thus forming an integrated environment for solving model diagnosis problems." | |||
** http://www2-pcmdi.llnl.gov/cdat | |||
* crowdLabs: "crowdLabs is a social visualization repository for the scientific workflow management system VisTrails" | |||
** http://www.crowdlabs.org/ | |||
* | * NBCR: "NBCR’s roles has been to anticipate and to ease the transition through technology changes for the biomedical community, thus allowing the community to harness the new capabilities without having to invest time to either redevelop codes or algorithms or implement on new machines. Thus, through bridging the gap between biomedical communities computing and more generally information technology needs and the advanced infrastructure (compute, data, visualization, software), the biomedical research community can stay focused on its own research." | ||
** https://www.nbcr.net/pub/wiki/index.php?title=VisTrails&redirect=no | |||
* | * NITRC: "The Neuroimaging Informatics Tools and Resources Clearinghouse (NITRC) facilitates finding and comparing neuroimaging resources for functional and structural neuroimaging analyses—including popular tools as well as those that once might have been hidden in another researcher's laboratory or some obscure corner of cyberspace." | ||
** http://www.nitrc.org/frs/?group_id=75&release_id=936 | |||
* | * EO4VisTrails: Adds spatial and temporal data access, data pre-processing and data analysis capabilities to VisTrails. This includes cloud, analytics and standards-based spatial data access. | ||
** https://code.google.com/p/eo4vistrails; http://ict4eo.github.io/ | |||
{| align="center" | |||
|- | |||
| [[Image:eo4v_SOS_Workflow.png|124px]] | |||
| [[Image:eo4v_GeoConfiguration_Parameters.png|137px]] | |||
| [[Image:eo4v_Matplotlib_WindRose.png|93px]] | |||
| [[Image:eo4v_Spreadsheet_MapCanvas_Alaska.png|112px]] | |||
| [[Image:eo4v_excel_processing_workflow.png|58px]] | |||
|- | |||
|} | |||
Latest revision as of 15:50, 25 August 2015
News
- Check out the new Software for Assisted Habitat Modeling (SAHM) package for VisTrails at http://www.mesc.usgs.gov/products/software/sahm/. SAHM was developed by Jeff Morrisette's group at the USGS. Colin Talbert is responsible for much of the code including the VisTrails wrapping. The package expedites habitat modeling and help maintain a record of the various input data, pre- and post- processing steps, and modeling options incorporated in the construction of a species distribution model.
- A tutorial about the SAHM Package for VisTrails is now available. Check out the new tutorial for the Software for Assisted Habitat Modeling (SAHM) package in VisTrails, by N. Young.
- Thomas Maxwell (NASA) has demoed his UV-CDAT package, vtDV3D at SC11. UV-CDAT is a new system for climate data analysis that combines VisTrails, CDAT and ParaView.
- vtDV3D supports advanced (VTK-based) visualization and (CDAT-based) analysis of climate data.
- Documentation is available at http://portal.nccs.nasa.gov/DV3D.
|

|
- The Opal plugin for VisTrails has been released. For more information see the NBCR Public Wiki: https://www.nbcr.net/pub/wiki/index.php?title=VisTrails
- ALPS 2.0 has been released and is now fully integrated with VisTrails. For details see the ALPS Web page.
- A description of the ALPS 2.0 system is now available at http://arxiv.org/abs/1101.2646. This is an example of an executable paper, whose results can be reproduced and verified. Check out this video which shows how we create and modify executable papers using VisTrails: http://www.vistrails.org/images/executable_paper_latex.mov
- LifeMapper clients for VisTrails have been released. See http://biodiversity.ku.edu/blog/lab-notes/lifemapper-vistrails-better-science for details.
Incomplete List of Projects that use VisTrails
- NASA Earth Exchange (NEX)
- vtDV3D is a Vistrails package of high-level modules for UV-CDAT developed by Thomas P. Maxwell (NASA). It provides user-friendly workflow interfaces for advanced visualization and analysis of climate data at a level appropriate for scientists. This project is motivated by the observation that climate scientists can greatly benefit from advanced visualization methods, but they rarely use these tools because the existing interfaces are too complex. vtDV3D‘s simple GUI interface is designed to be readily used by busy scientists who have little time to invest in learning complex new frameworks. The application builds on VTK, an open-source, object-oriented library, for visualization and analysis.
- Lifemapper
- CMOP: "The Center for Coastal Margin Observation & Prediction (CMOP) seeks to develop and disseminate a new paradigm for conducting coastal-margin science, one that shifts from reactive to anticipatory science–i.e., from “observing and remediating” to “predicting and steering”–by taking advantage of the inherent power of structured integrations of information, methods and people: “collaborators". CMOP develops advanced 3D numerical simulation models for coastal margins as well as tools for calibrating the models and analyzing their results.
- DataOne: "The Data Observation Network for Earth (DataONE) is poised to be the foundation of new innovative environmental science through a distributed framework and sustainable cyberinfrastructure that meets the needs of science and society for open, persistent, robust, and secure access to well-described and easily discovered Earth observational data."
- ALPS: "The ALPS project (Algorithms and Libraries for Physics Simulations) is an open source effort aiming at providing high-end simulation codes for strongly correlated quantum mechanical systems as well as C++ libraries for simplifying the development of such code. ALPS strives to increase software reuse in the physics community."
- Analyzing the results of astrophysics CFD simulations
- VACET: "The Visualization and Analytics Center for Enabling Technologies (VACET) focuses on leveraging scientific visualization and analytics software technology as an enabling technology for increasing scientific productivity and insight. Advances in computational technology have resulted in an "information big bang," which in turn has created a significant data understanding challenge. This challenge is widely acknowledged to be one of the primary bottlenecks in contemporary science. Using an organizational model such as VACET, we are well positioned to respond to the needs of a diverse set of scientific stakeholders in a coordinated fashion using a range of visualization, mathematics, statistics, computer and computational science and data management technologies."
- ParaView: "ParaView is an open-source, multi-platform data analysis and visualization application. ParaView users can quickly build visualizations to analyze their data using qualitative and quantitative techniques. The data exploration can be done interactively in 3D or programmatically using ParaView's batch processing capabilities."
- CDAT: "Climate Data Analysis Tools (CDAT) is a software infrastructure that uses an object-oriented scripting language to link together separate software subsystems and packages thus forming an integrated environment for solving model diagnosis problems."
- crowdLabs: "crowdLabs is a social visualization repository for the scientific workflow management system VisTrails"
- NBCR: "NBCR’s roles has been to anticipate and to ease the transition through technology changes for the biomedical community, thus allowing the community to harness the new capabilities without having to invest time to either redevelop codes or algorithms or implement on new machines. Thus, through bridging the gap between biomedical communities computing and more generally information technology needs and the advanced infrastructure (compute, data, visualization, software), the biomedical research community can stay focused on its own research."
- NITRC: "The Neuroimaging Informatics Tools and Resources Clearinghouse (NITRC) facilitates finding and comparing neuroimaging resources for functional and structural neuroimaging analyses—including popular tools as well as those that once might have been hidden in another researcher's laboratory or some obscure corner of cyberspace."
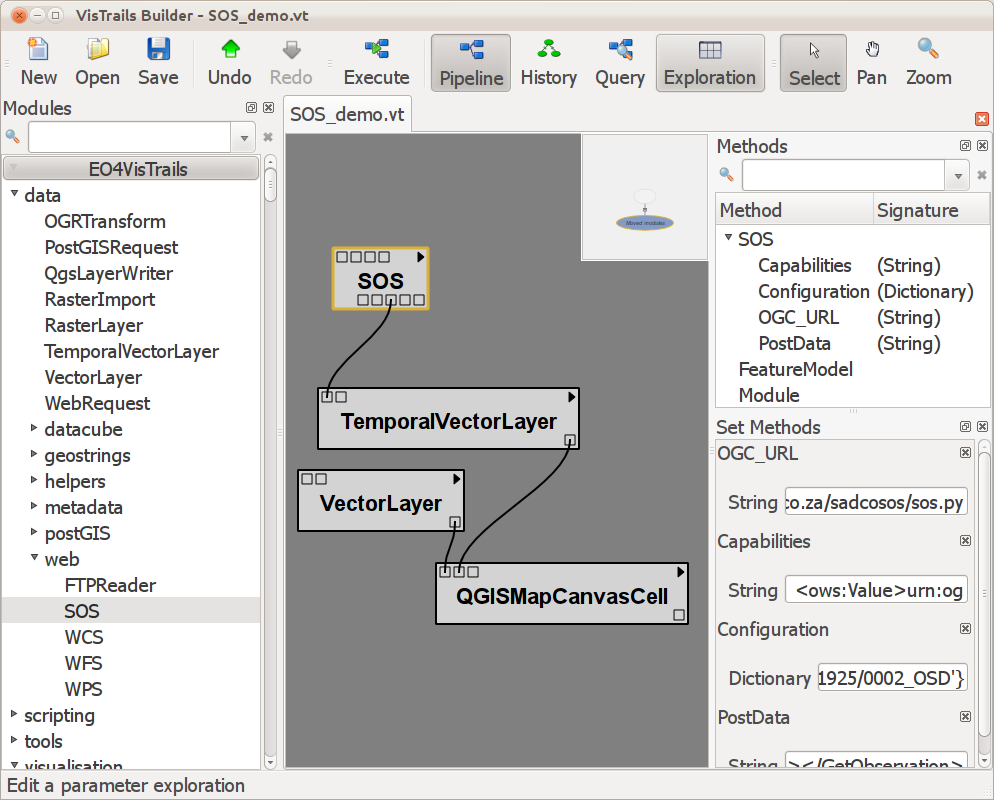
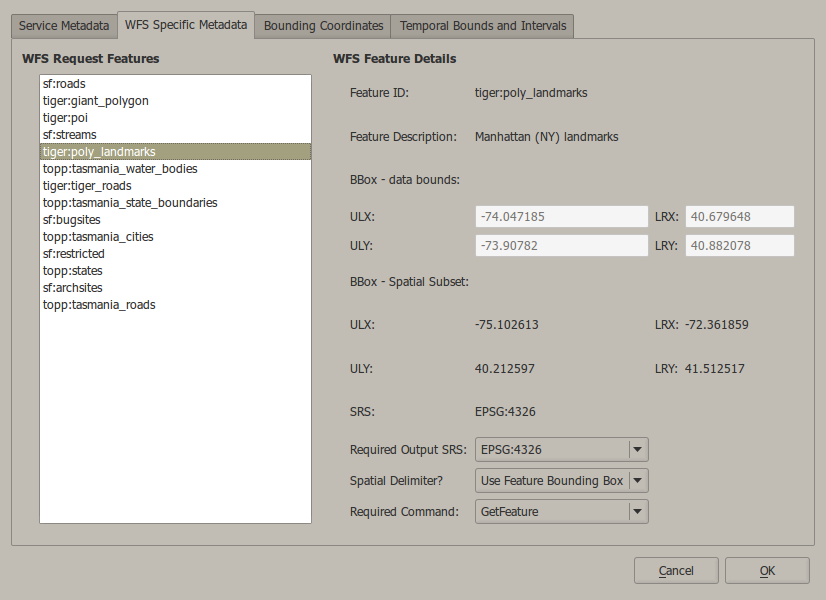
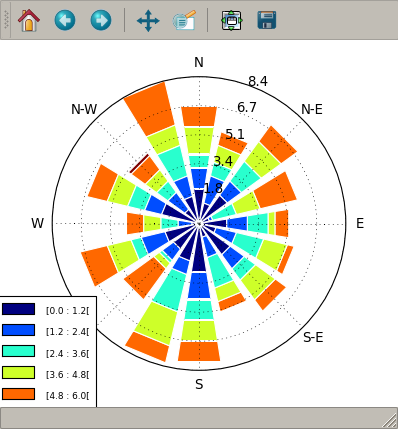
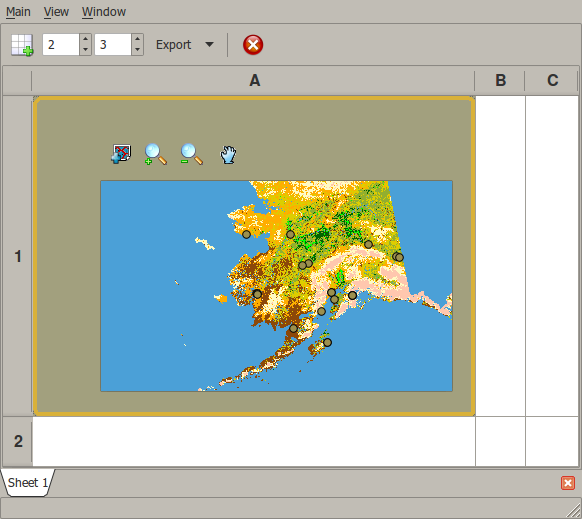
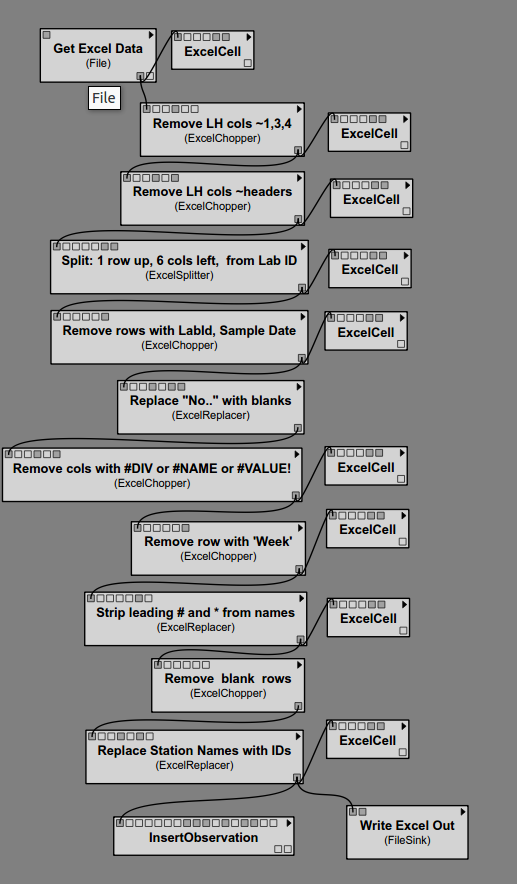
- EO4VisTrails: Adds spatial and temporal data access, data pre-processing and data analysis capabilities to VisTrails. This includes cloud, analytics and standards-based spatial data access.
|
|
|
|
|