Difference between revisions of "Wrffire"
| (12 intermediate revisions by 2 users not shown) | |||
| Line 4: | Line 4: | ||
== 3D Visualizations via VisTrails == | == 3D Visualizations via VisTrails == | ||
[[Image:wrfFire_streamlines1.png| | <div align=center> | ||
{| | |||
|[[Image:wrfFire_streamlines1.png|463px|"3D fire visualization (example1)"]] | |||
|[[Image:wrfFire_streamlines2.png|450px|"3D fire visualization (example2)"]] | |||
|} | |||
<div align=left> | |||
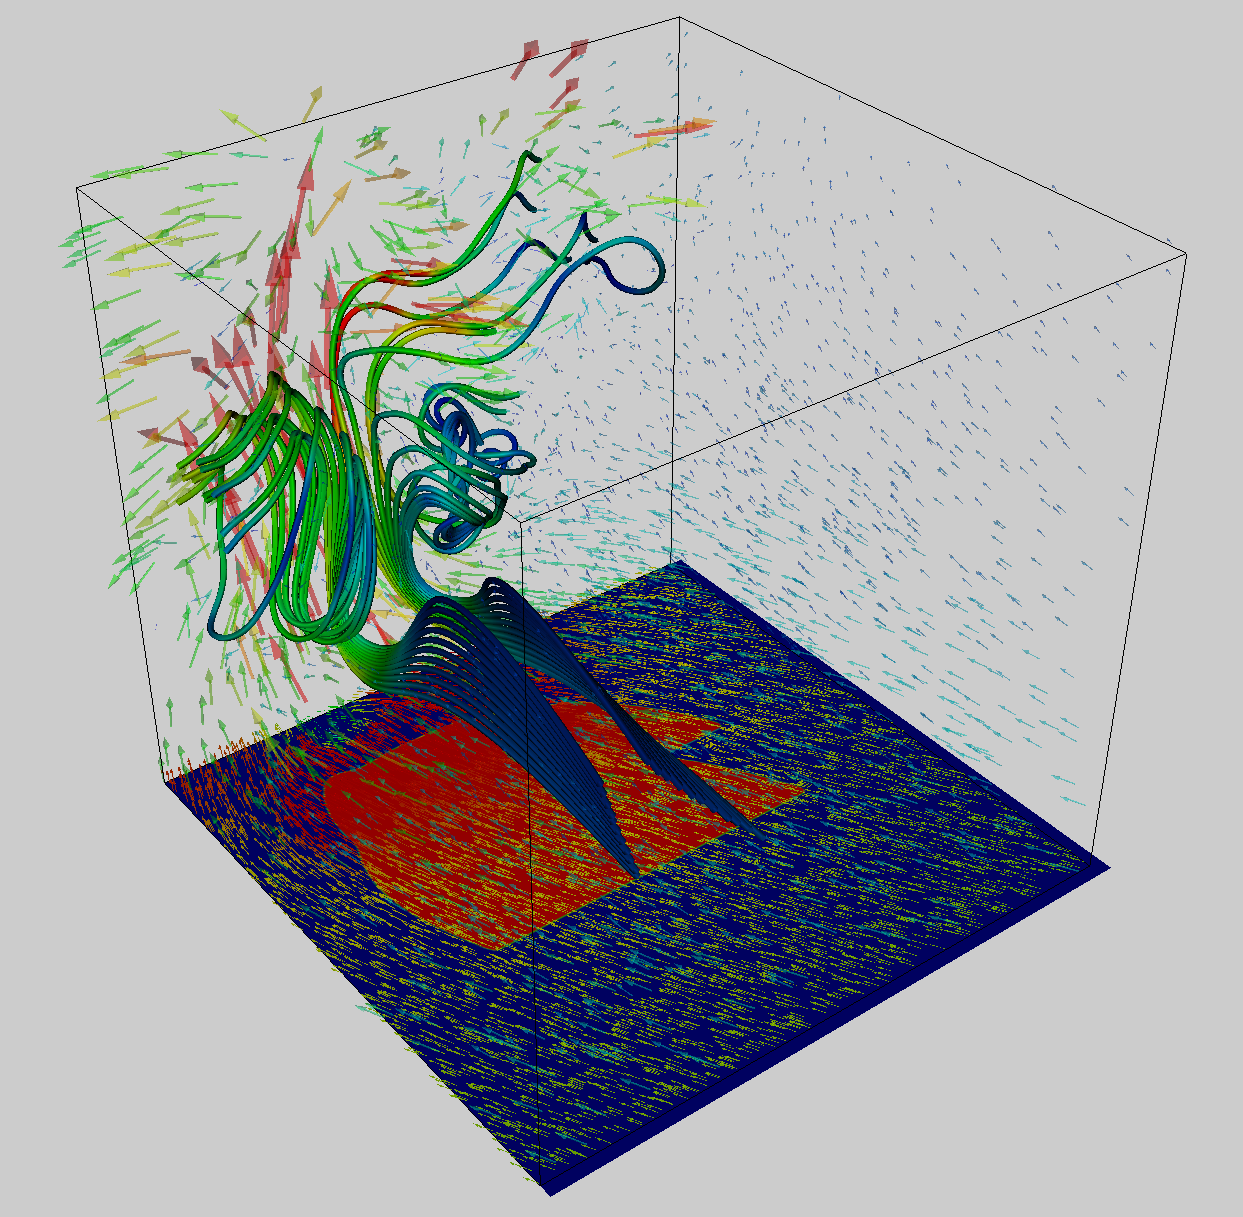
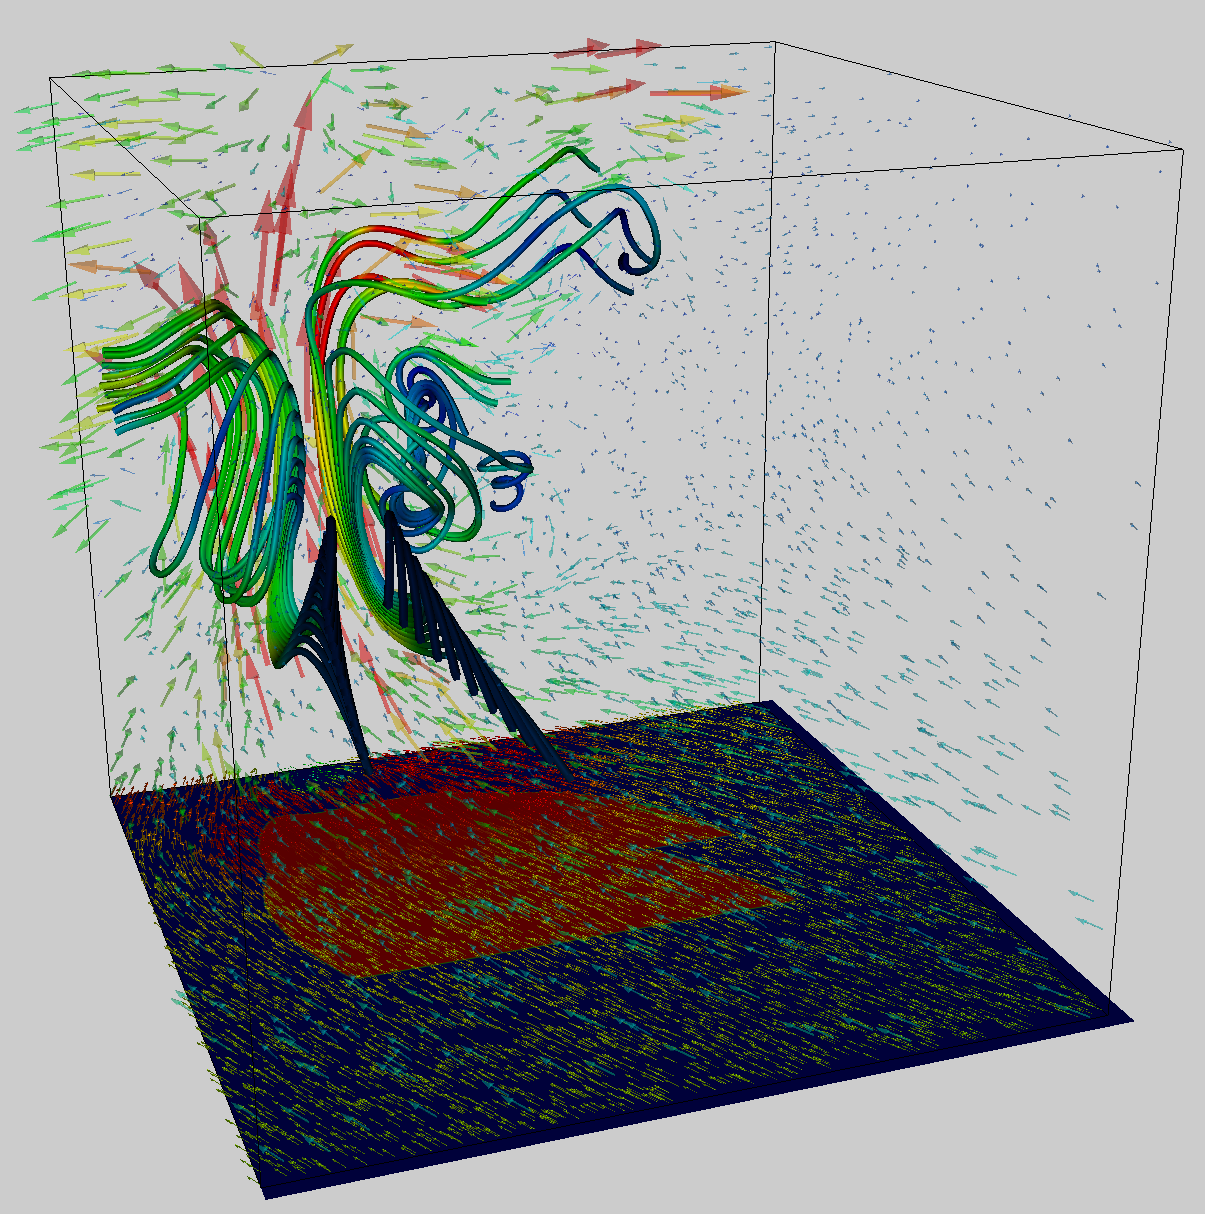
Above are screen shots from different view angles of a VisTrails visualization of wrf-fire simulation results. Specifically these visualizations illustrate the fire area, as well as the wind vectors on the surface and throughout the volume. The use of stream rakes improves the visualization of the wind's volumetric flow, highlighting the updraft and vortex features in the vector field. | |||
| Line 12: | Line 17: | ||
== Downloads and Setup == | == Downloads and Setup == | ||
In order to run the above visualizations on your machines, [[www.vistrails.org/index.php/Downloads/|download Vistrails]] from our website. We can make the additional userpackages and VisTrail files available upon request. | |||
= Super Computing Demo 2009 = | = Super Computing Demo 2009 = | ||
The above discussions highlight the currently available visualization results for the wrf-fire simulations. Below we further address possibilities that can be achieved via VisTrails. This section is intended to inspire conversation concerning what it is you would like to show during your demo's. In particular, discussing interesting visualizations of the data produced on your cluster, as well as the performance information of the cluster during the computation of this data. | |||
== Possibilities == | == Possibilities == | ||
=== Multiple Visualization Windows === | |||
{|{{Prettytable}} | |||
|[[Image:wrffire_multipleCells.png|top|450px|"side-by-side comparisons with multiple cells"]] | |||
| | |||
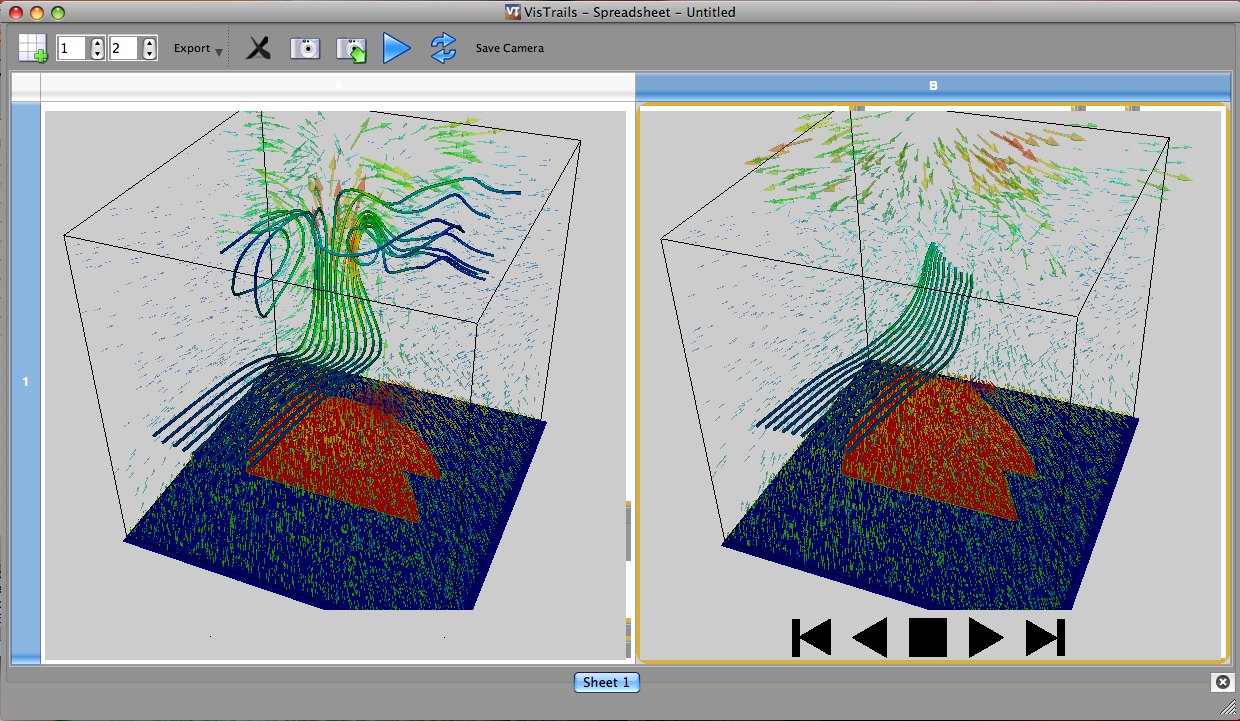
In addition to the single cell visualization, it is possible to do multiple cell displays for side-by-side comparisons of different data sets. This may be useful if comparing visualizations from multiple data sets, i.e. two different simulation runs at similar time-steps but with different initial conditions, or the same simulation run at two different time steps (shown at left). | |||
|} | |||
=== Performance Visualization === | |||
{|{{Prettytable}} | |||
|[[Image:Iso_plots.png|top|450px|"performance analysis with multiple cells"]] | |||
| | |||
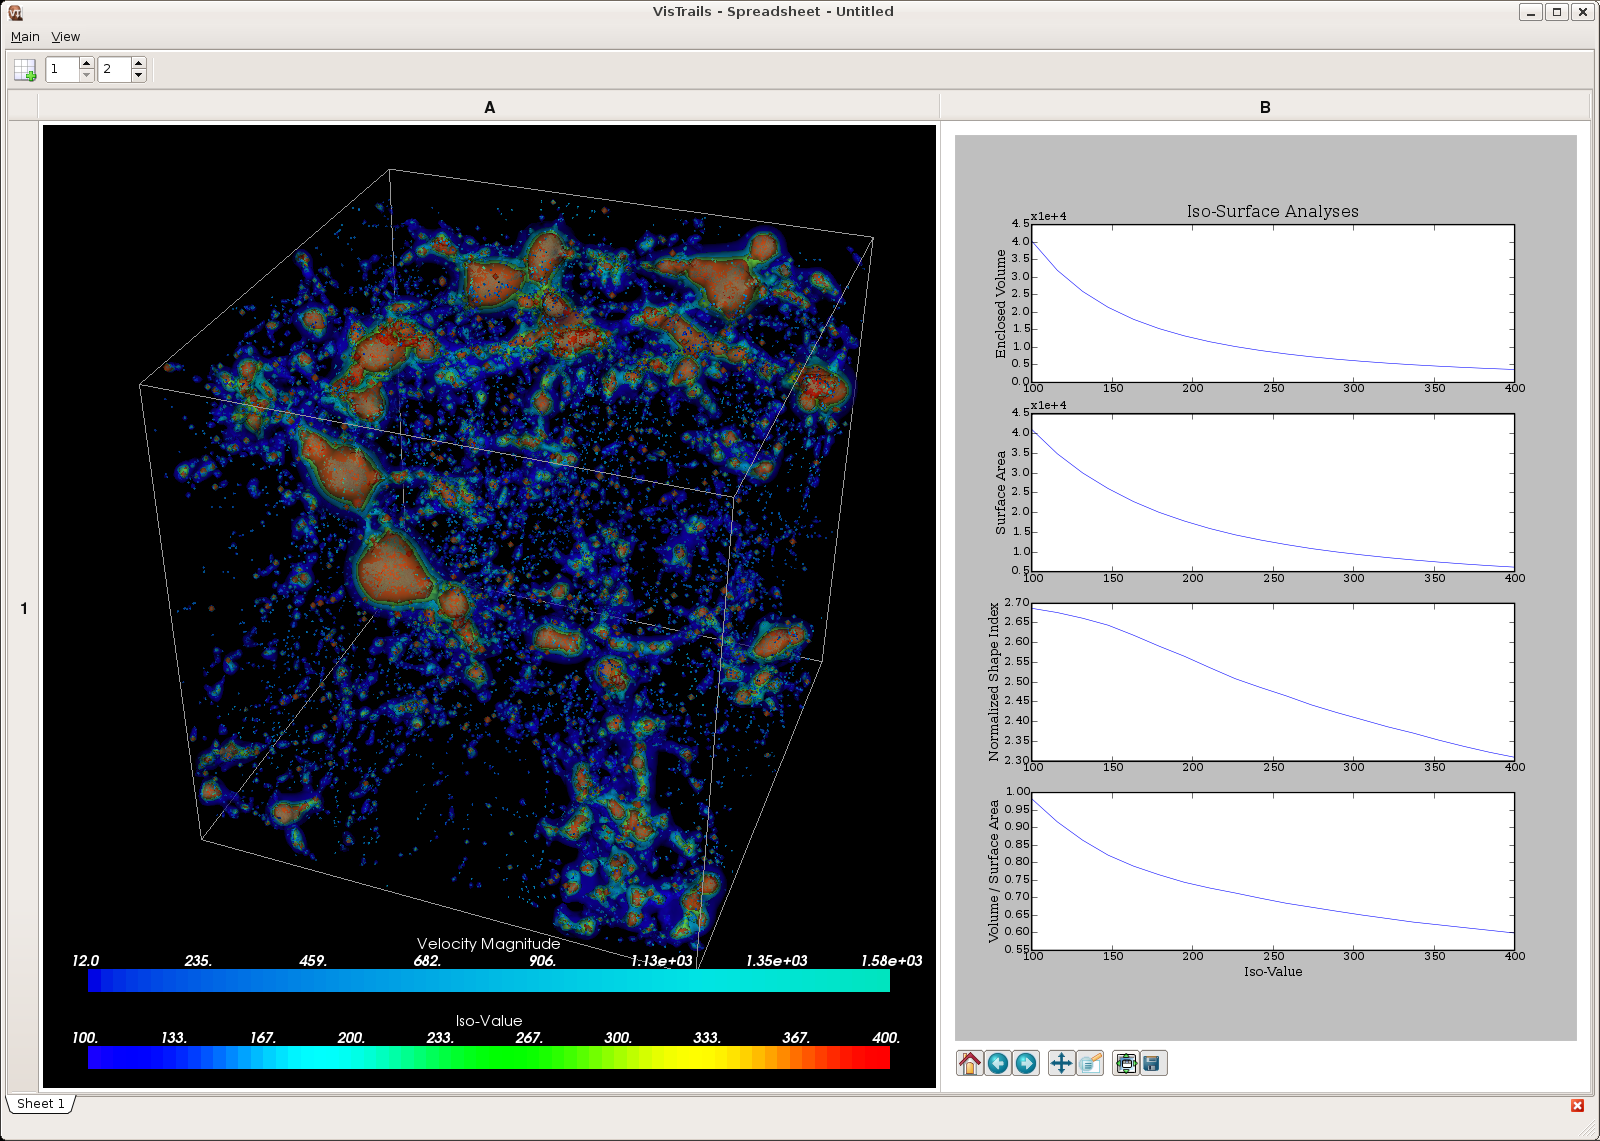
For the SC2009 demo purposes, we envision using the multiple cell display to simultaneously display the 3D visualizations of the simulation outputs with performance graphs that track the computations performed by the nodes on the cluster. An example of the multiple cell visualizations is shown above. Furthermore, it is possible to open multiple sheets within the VisTrails spreadsheet, such that performance graphs can be hidden while viewing the simulation visualizations, and vice-versa. | |||
|} | |||
=== Scheduling Remote Executions === | |||
We have support for the execution of the wrf-fire simulation code on a remote server, in addition to the visualization. Our wrf-fire server code would need to be slightly modified in order to correctly communicate with your scheduler. The remote execution model supports the querying of new simulation result files and handles the transfer of new files to the local machine. With this added functionality, the entire simulation code can be managed through VisTrails. | |||
== Key Questions == | == Key Questions == | ||
* Would it be useful to visualize performance data measured on your cluster during the simulation computation? | |||
* Would you like us to handle the running of the wrf-fire simulation? | |||
** If so, how does one schedule a process on your cluster? | |||
Latest revision as of 02:18, 31 October 2009
WRF-Fire Project
This page introduces the possibilities VisTrails provides in relation to the WRF-Fire Simulation project.
3D Visualizations via VisTrails

|

|
Above are screen shots from different view angles of a VisTrails visualization of wrf-fire simulation results. Specifically these visualizations illustrate the fire area, as well as the wind vectors on the surface and throughout the volume. The use of stream rakes improves the visualization of the wind's volumetric flow, highlighting the updraft and vortex features in the vector field.
The VisTrail that produces these images reads in the wrfout NetCDF file produced by the simulation. It extracts the specified variables at a single time step, and displays an interactive 3D visualization within a single cell of the VisTrails' spreadsheet. The images shown are screen shots of this cell.
Downloads and Setup
In order to run the above visualizations on your machines, download Vistrails from our website. We can make the additional userpackages and VisTrail files available upon request.
Super Computing Demo 2009
The above discussions highlight the currently available visualization results for the wrf-fire simulations. Below we further address possibilities that can be achieved via VisTrails. This section is intended to inspire conversation concerning what it is you would like to show during your demo's. In particular, discussing interesting visualizations of the data produced on your cluster, as well as the performance information of the cluster during the computation of this data.
Possibilities
Multiple Visualization Windows
Performance Visualization
Scheduling Remote Executions
We have support for the execution of the wrf-fire simulation code on a remote server, in addition to the visualization. Our wrf-fire server code would need to be slightly modified in order to correctly communicate with your scheduler. The remote execution model supports the querying of new simulation result files and handles the transfer of new files to the local machine. With this added functionality, the entire simulation code can be managed through VisTrails.
Key Questions
- Would it be useful to visualize performance data measured on your cluster during the simulation computation?
- Would you like us to handle the running of the wrf-fire simulation?
- If so, how does one schedule a process on your cluster?

